Figure 14.

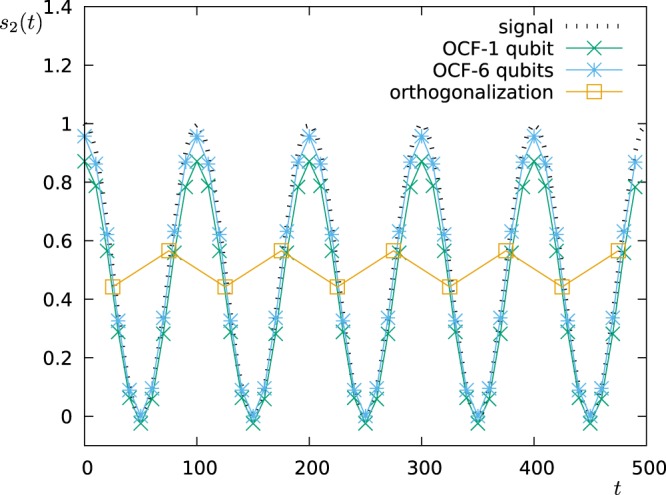
Detection of temporal changes in the spectrum. We plot the time-dependent coefficient s2(t) as modelled (signal: , ωosc = 0.01π) and as reconstructed by the two approaches FO (for 1 qubit) and OCF (for 1 and 6 qubits).

Detection of temporal changes in the spectrum. We plot the time-dependent coefficient s2(t) as modelled (signal: , ωosc = 0.01π) and as reconstructed by the two approaches FO (for 1 qubit) and OCF (for 1 and 6 qubits).