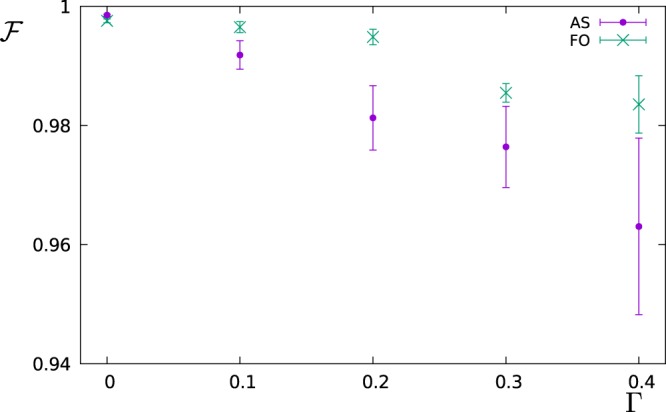
Figure 3.

The figure shows the fidelity for the estimation of the power spectral density S(ω) as a function of the dephasing rate Γ. For each value of Γ, we choose the filter operation time such that the fidelity is maximized. This optimal time is obtained from a scan of different values of the filter operation time T both for the AS and FO protocol as in the example of Fig. 2. The optimal filter operation time depends on Γ and on the protocol, and was found to be in the range [5, 25] for the AS protocol and [2, 5] for the FO protocol.
