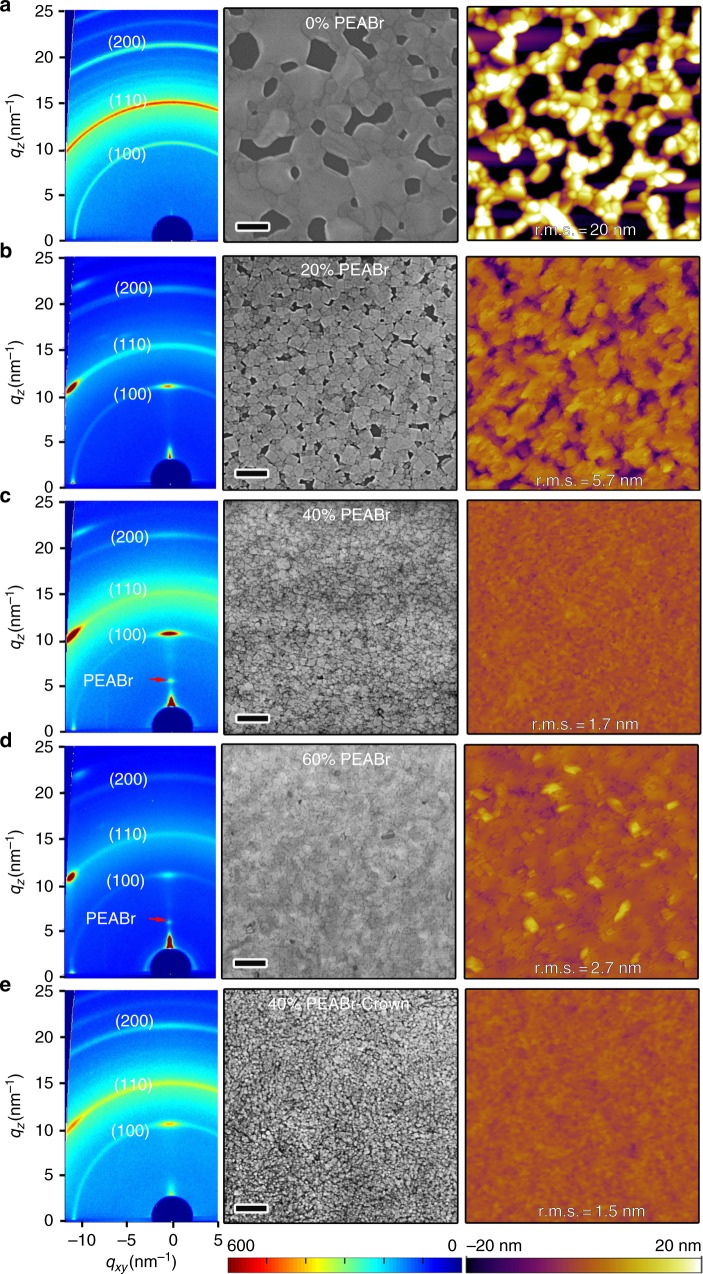
Fig. 1.
2D GIXRD and morphology study of the perovskite films. 2D GIXRD patterns (left), SEM (middle), and AFM (right) images of the perovskite films with: a 0% PEABr, b 20% PEABr, c 40% PEABr, d 60% PEABr, and e 40% PEABr-crown. The PEABr molar ratio of x% PEABr means . The red arrows in the 2D GIXRD images highlight new diffraction peaks of PEABr at the high PEABr concentration. The scale bar of SEM images is 200 nm. The scan area of all AFM images is 2 µm × 2 µm

