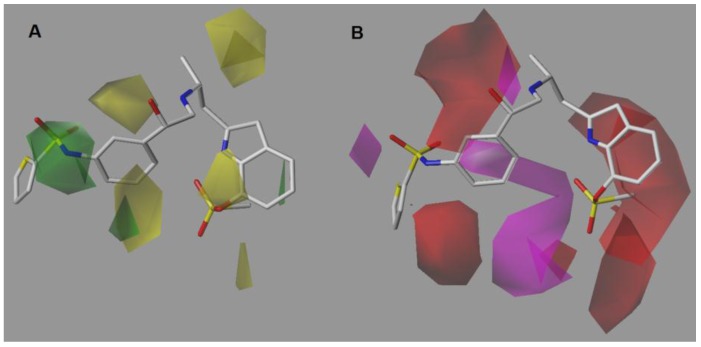
Figure 3.
CoMSIA-SA model around compound 9, the most potent of the series. (A) Steric contour map. Green contours indicate regions where bulky groups improve activity, whereas yellow contours indicate regions were bulky groups decreases activity. (B) Hydrogen-bond acceptor contour map. Magenta contours indicate regions where hydrogen-bond acceptor groups increase activity, whereas red contours indicate regions where hydrogen-bond acceptor groups decrease activity.

