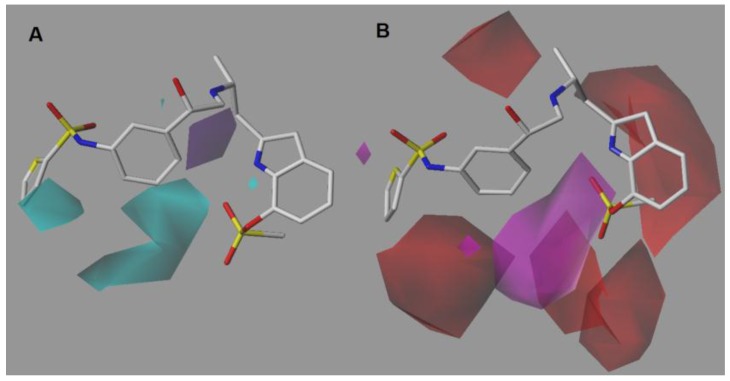
Figure 4.
CoMSIA DA model around compound 9, the most potent of the series. (A) Donor contour map. Cyan contours indicate regions where hydrogen-bond donors increase activity, whereas purple contours indicate regions where hydrogen-bond donors decrease activity. (B) Acceptor contour map. Colors have the same meaning as explained in Figure 3B.

