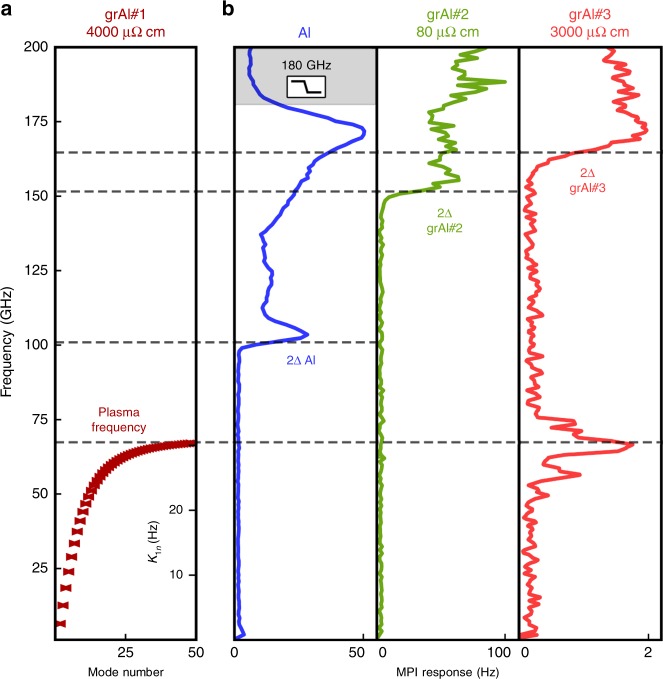
Fig. 4.
Measurement of the dispersion relation in grAl resonators. a Calculated dispersion relation f(n) for resonator grAl#1 starting from two-tone measurements of the third mode (see text). The spectrum saturates at the effective plasma frequency 68 ± 0.1 GHz. From Eq. (4), the cross-Kerr coefficients follow the dispersion relation, and their values are reported on the right axis. A significant cross-Kerr coupling enables the observation of the high-frequency spectrum up to the effective plasma frequency: photons populating the high end of the spectrum shift the low-lying eigen frequencies, which can be monitored via standard RF transmission measurements (see Fig. 2d). b Martin–Puplett Interferometer (MPI) response of Hilbert-shaped resonators made of 25-nm-thick Al, grAl with resistivity 80 μΩ cm (grAl#2), and grAl with resistivity 3000 μΩ cm (grAl#3). The illumination frequencies generated by the MPI range from a few GHz up to 200 GHz, with a resolution of 1 GHz. The different superconducting gaps of the films are evidenced by a strong MPI response due to quasiparticle excitation at 100 GHz for Al, at 150 GHz for grAl#2, and at 165 GHz for grAl#3. For the sample with the highest resistivity and the lowest critical current density, grAl#3, we observe a peak around 65 GHz, in the vicinity of the ωp predicted from low-frequency measurements on sample grAl#1, with a similarly high resistivity (4000 μΩ cm, see text for details). This MPI response can be seen as the summed dispersive frequency shift due to cross-Kerr interactions K1n between the fundamental mode and all higher populated modes

