Fig. 3.
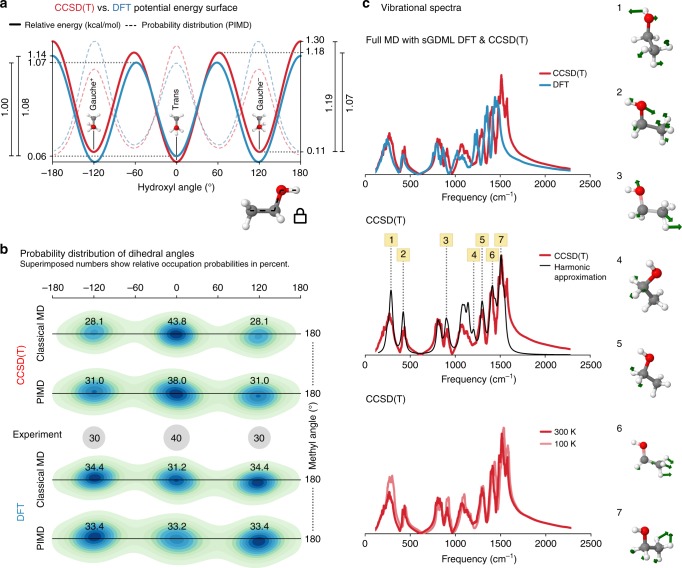
Molecular dynamics simulations for ethanol. a Potential energy profile of the dihedral angle describing the rotation of the hydroxyl group for CCSD(T) (red) vs. DFT (blue). The energetic barriers predicted by sGDML@CCSD(T) are: Mt → Mg: 1.18 kcal mol−1, Mg− → Mg+: 1.19 kcal mol−1, and Mg → Mt: 1.07 kcal mol−1. The dashed lines show the probability distributions obtained from PIMD at 300 K. b Joint probability distribution function for the two dihedral angles of the methyl and hydroxyl functional groups. Each minimum is annotated with the occupation probability obtained from classical and path-integral MD in comparison with experimental values. c Analysis of vibrational spectra (velocity–velocity autocorrelation function). (top) Comparison between the vibrational spectrum obtained from PIMD simulations at 300 K for sGDML@CCSD(T) and its sGDML@DFT counterpart; (middle) comparison between the sGDML@CCSD(T) PIMD spectrum and the harmonic approximation based on CCSD(T) frequencies; (bottom) comparison of sGDML@CCSD(T) PIMD spectra at 300 and 100 K. The rightmost panel shows several characteristic normal modes of ethanol, where atomic displacements are illustrated by green arrows

