Fig. 4.
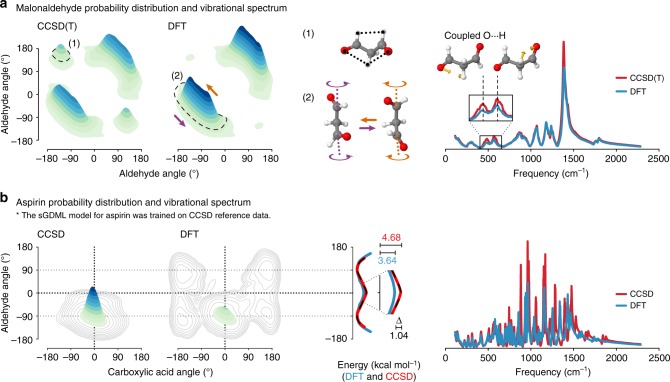
Analysis of MD simulations with sGDML for malonaldehyde and aspirin. The MD simulations at 300 K were carried out for 500 ps. a Joint probability distributions of the dihedral angles in malonaldehyde, describing the rotation of both aldehyde groups based on classical MD simulations for sGDML@CCSD(T) and sGDML@DFT. The configurations (1) and (2) are representative structures of the most sampled regions of the PES. b Joint probability distributions of the dihedral angles in aspirin, describing the rotation of the ester and carboxylic acid groups based on PIMD simulations for sGDML@CCSD and sGDML@DFT using 16 beads at 300 K. The potential energy profile for the ester angle in kcal mol−1 is shown for sGDML@CCSD (red), sGDML@DFT (blue) and compared with the CCSD reference (black, dashed). Contour lines show the differences of both distributions on a log scale. Both panels also show a comparison of the vibrational spectra generated via the velocity-velocity autocorrelation function obtained with sGDML@CCSD(T)/CCSD (red) and sGDML@DFT (blue)

