Figure 2.
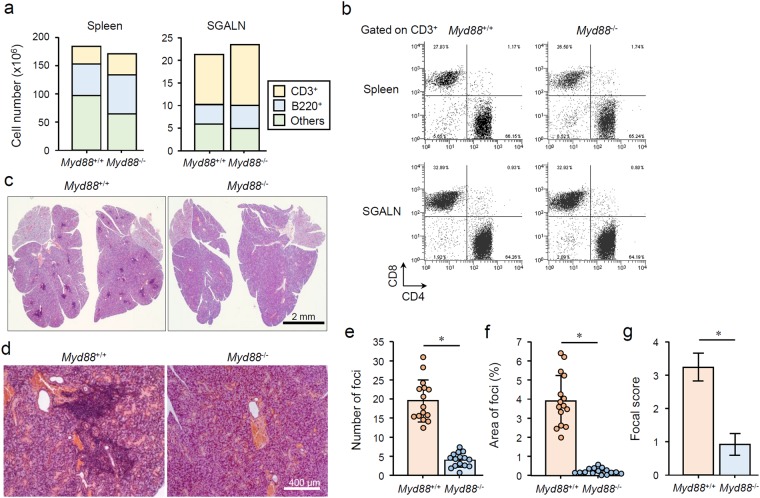
MyD88-dependent AS manifestation in NOD mice. (a) Total number of CD3+, B220+, and CD3−B220− cells collected from spleen (left graph) and SGALN (right graph) of 12-week-old female Myd88+/+ and Myd88−/− NOD mice were calculated using flow cytometry. Similar results were obtained from all four animals for each strain, therefore a representative result is shown. (b) Flow cytometric analysis of CD3+ T cells from spleen (upper) and SGALN (lower) of Myd88+/+ and Myd88−/− NOD mice. Representative plots for CD4/CD8 expression of four separate experiments are shown. (c) Representative H&E-stained sections of whole SG from Myd88+/+ (left) and Myd88−/− (right) NOD mice. Original magnification: ×1.5. (d) Representative areas of H&E-stained sections of SGs from Myd88+/+ (left) and Myd88−/− (right) NOD mice. Original magnification: ×10. (e) Number of foci in SG sections evaluated from fifteen mice per genotype. Results are expressed as mean ± SD (bar graph) of mean values of total foci numbers of four SG sections per animal (circle point). *p < 0.01. (f) Percentage of total area of foci in SG sections evaluated from fifteen mice per genotype. Results are expressed as mean ± SD (bar graph) of mean values of percentage of total foci area of four SG sections per animal (circle point). *p < 0.01. (g) Focal scores of SG sections evaluated from fifteen mice per genotype. Results are expressed as mean ± SD of mean values of the scores of four SG sections per animal. *p < 0.01.

