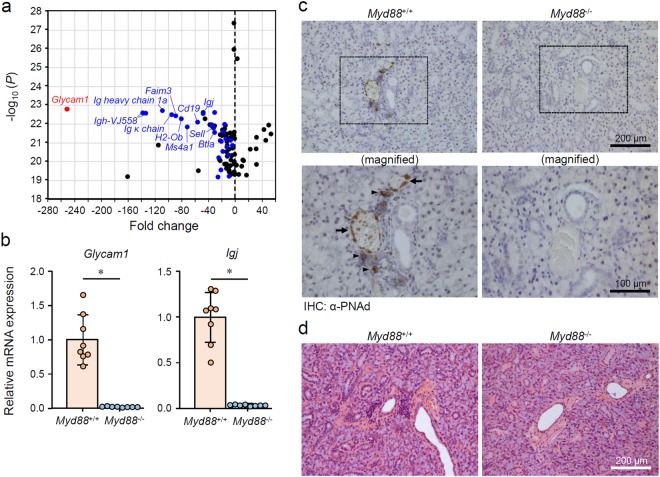
Figure 3.
MyD88-dependent TLO formation-associated changes in SGs from normal female B6 mice. (a) A volcano plot of the microarray data (top 100 P values) of mRNA expression in SMGs from 10-week-old female Myd88−/− B6 mice compared with Myd88+/+ mice (n = 3 per genotype). A red dot indicates Glycam1, blue dots indicate B cell- or lymphocyte-associated genes, and black dots represent other genes. The complete list of 100 genes are in Supplementary Table 1. (b) qRT-PCR analysis of Glycam1 and Igj expression in whole SMGs from Myd88+/+ B6 mice and Myd88−/− B6 mice (n = 8 per genotype). Expression levels are calculated relative to Hprt expression. Results are expressed as mean ± SD (bar graph). *p < 0.01. (c) Representative areas of anti-PNAd (MECA-79) antibody-stained sections of SGs from Myd88+/+ (left) and Myd88−/− (right) B6 mice. Arrows and arrowheads indicate HEV-like vessels and probable HEV precursor cells, respectively. Original magnification: ×20 (upper) and ×40 (lower). Additional images are also shown in Supplementary Fig. 4. (d) Representative areas of H&E-stained sections of SGs from Myd88+/+ (left) and Myd88−/− (right) B6 mice. Original magnification: ×20. Additional images are also shown in Supplementary Fig. 6.

