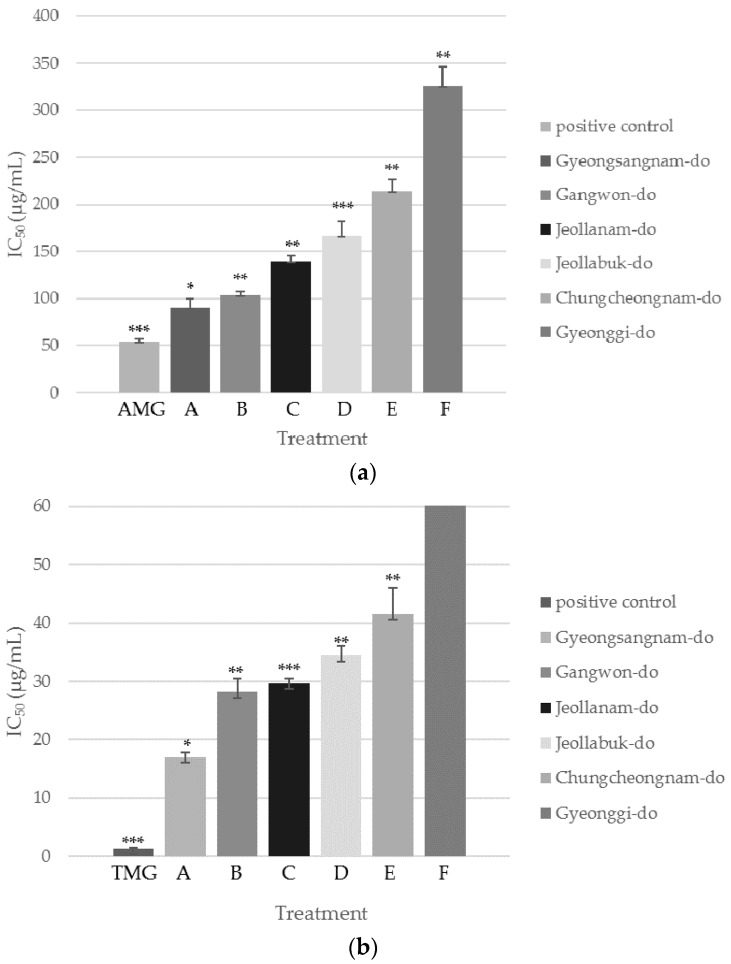
Figure 1.
(a) IC50 values of SCS extracts from different provinces of Korea in AGEs assay; (b) IC50 values of SCS extracts from different provinces of Korea in AR assay. Values are presented as mean ± SD (n = 3). * p < 0.05 compared with the positive control group; ** p < 0.01 compared with the positive control group; *** p < 0.001 compared with the positive control group (Student’s t test).

