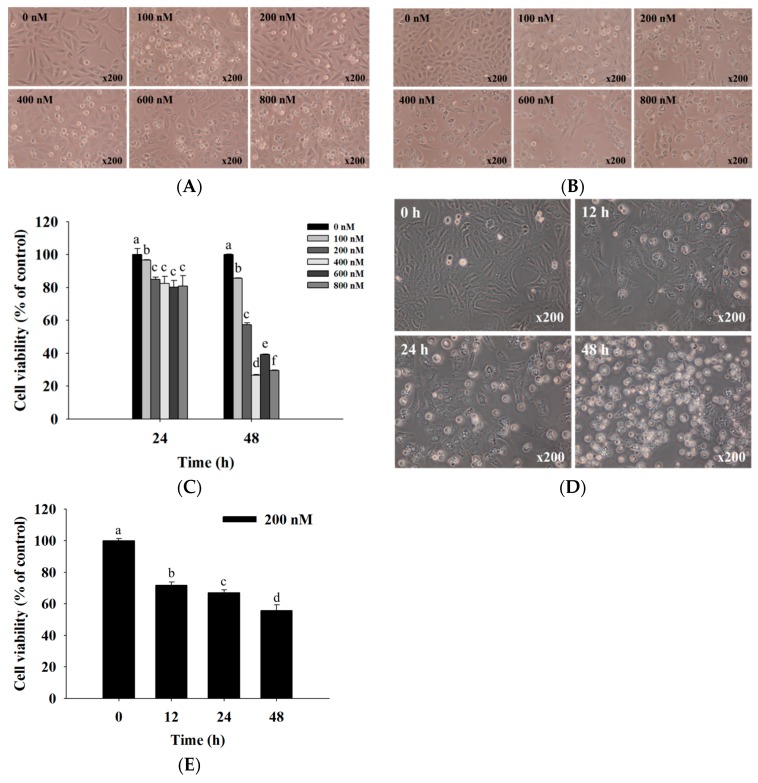
Figure 1.
Bufalin induced cell morphological changes and decreased the viability of U-2 OS cells. Cells were treated with 0, 100, 200, 400, 600, and 800 nM of bufalin for (A) 24 h and (B) 48 h before the cells were examined and photographed for cell morphological changes by contrast-phase microscopy at ×200 and (C) were harvested for total percentage of viable cells measurements; or (D) were treated with 200 nM bufalin for various time periods before the cells were examined and photographed for cell morphological changes by contrast-phase microscopy at ×200; and (E) were harvested for total percentage of viable cells measurements. Morphological changes and total viable cells were observed by flow cytometry, as described in Materials and Methods. Different letters mean significant difference between bufalin-treated groups and the control as analyzed by one-way analysis of variance (ANOVA), followed by Duncan’s multiple range test (DMRT).

