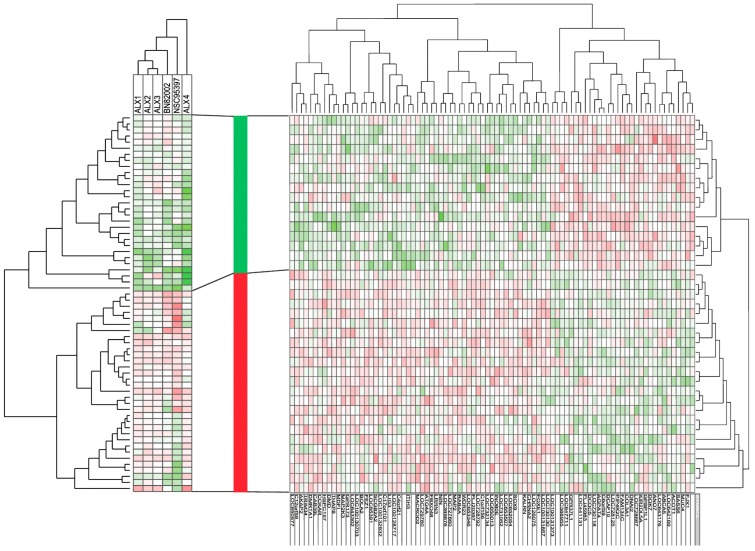
Figure 3.
Comparison of gene expression profiles for primary human AML cells—a comparison of AML cell populations with and without an antiproliferative effect of CDC25 inhibitors. (LEFT) Cells derived from 62 AML patients were cultured in suspension cultures ((3H)-thymidine incorporation assay), in combination with six different CDC25 inhibitors (ALX1-4, BN82002 and NSC95397). Only patients without the t(15;17) cytogenetic aberration and with proliferation above >1000 cpm, both in control and drug-containing cultures, were included in this analysis. The (3H)-thymidine incorporation (cpm) for drug-containing cultures was made relative to the incorporation for corresponding drug-free controls and thereafter log2 converted. These values were then used for an unsupervised hierarchical cluster analysis (weighted pair group method with averaging, Euclidian distance measure). Green color represents an inhibitory and thus antiproliferative effect. (MIDDLE) Based on this analysis, the patients could be divided into two main subsets, as indicated by the bar between the two main parts of the figure; responders showing antiproliferative effects (green part of the column) and non-responders with no antiproliferative effect and even showing growth enhancement (red part of the column) in the presence of CDC25 inhibitors. (RIGHT) Global gene expression profiles were available for 39 unselected patients (16 with antiproliferative and 23 without antiproliferative effects of CDC25 inhibition). Patients with and without antiproliferative effects were compared by a feature subset analysis, and 87 differentially expressed genes (p < 0.003) were detected. These 87 genes could be used for a hierarchical cluster analysis (weighted pair group method with averaging, Euclidian distance measure) that divided the patients into two main subsets, corresponding to the 16 patients with and the 23 patients without an antiproliferative effect induced by CDC25 inhibitors. Green indicates upregulated genes and red indicates downregulated genes.

