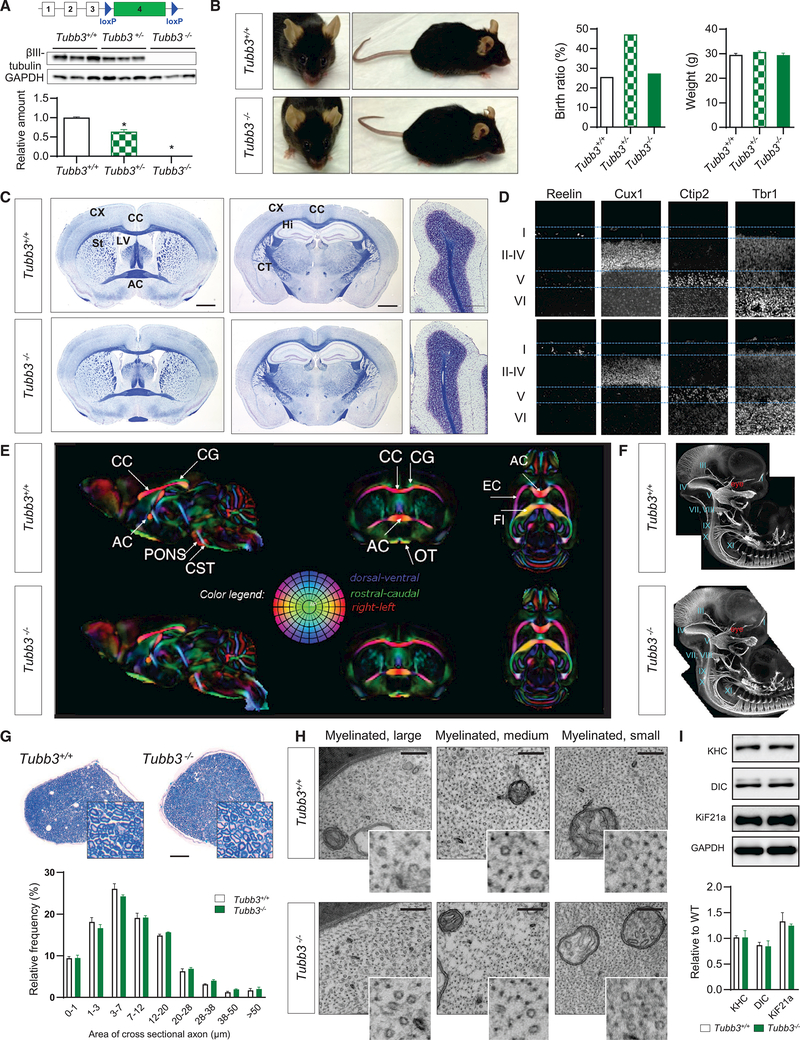
Figure 1. Tubb3−/− Mice Are Viable with No Major Anatomical Abnormalities.
(A) Genetic construct to produce Tubb3 knockout mice. Mice were crossed with Ella-cre mice. Bottom: detection of TUBB3 in brain of E14.5 wild-type, Tubb3+/−, and Tubb3−/− mice by western blot and quantification (N = 9).
(B) Left: wild-type and Tubb3−/− littermates at 14 months of age. Middle: Mendelian birth ratio in WT (N = 14), Tubb3+/− (N = 26), and Tubb3−/− mice (N = 15). Right: weight gain of same mice at 3 months of age.
(C) Adult wild-type and Tubb3−/− mice brains stained with Luxol fast blue for myelin and Nissl counterstain. Coronal sections at the level of the anterior commissure (left) and hippocampus (middle), and sagittal sections of cerebellum (right) reveal no detectable abnormalities in architecture of corpus callosum (CC), anterior commissure (AC), cortex (CX), striatum (St), hippocampus (Hi), corticospinal tract (CT), lateral ventricle (LV), and cerebellum in Tubb3−/− mice compared to wild-type. Absence of the wild-type optic nerve at the level of the AC resulted from detachment during processing. Scale bars, 400 (left and middle) and 100 mm (right). N = 5.
(D) Cortical layers in wild-type (top, N = 5) and Tubb3−/− (bottom, N = 4) P2 mice. Brain sections stained for Reelin (layer I), Cux-1 (layers II–IV), Ctip2 (layer V), and Trb1 (layer VI).
(E) Directionally encoded color maps from diffusion tensor imaging of adult wild-type (top) and Tubb3−/− (bottom) mice to examine white matter tracts. A group template was generated for each strain and compared to identify potential anatomical abnormalities in the mutant template. Side-by-side slice views in each of the orthogonal orientations are shown at the same level in both the wild-type and Tubb3−/− templates. Red, left-right; green, dorsal-ventral; and blue, rostralcaudal. CG, cingulum; PF, pontine fibers; OT, optic tract; EC, external capsule; FI, fimbria; for other abbreviations refer to (C). N = 4+/+, 3–/–.
(F) Anatomy of cranial and spinal nerves stained with NF-M in E11.5 whole-mount embryos of wild-type and Tubb3−/− mice. I–XI: corresponding cranial nerves. N = 6 for each genotype.
(G) Top: representative bright-field cross-sectional images of sciatic nerve from wild-type and Tubb3−/− mice stained with toluidine blue. Scale bar, 100 mm. Bottom: distributions of myelinated fibers of different diameters in wild-type and Tubb3−/− mice. N = 3.
(H) Ultrastructure of myelinated large, medium, and small diameter fibers in cross-sectional images of adult wild-type and Tubb3−/− sciatic nerves. 49,0003. Inset: magnification highlights cytoskeletal MTs and neurofilaments. N = 3. Scale bar, 100 nm.
(I) Top: representative western blot and quantification of motor protein levels in sciatic nerve tissue lysates of adult wild-type and Tubb3−/− mice. Bottom: quantification (n = 3).
See also Figure S1.

