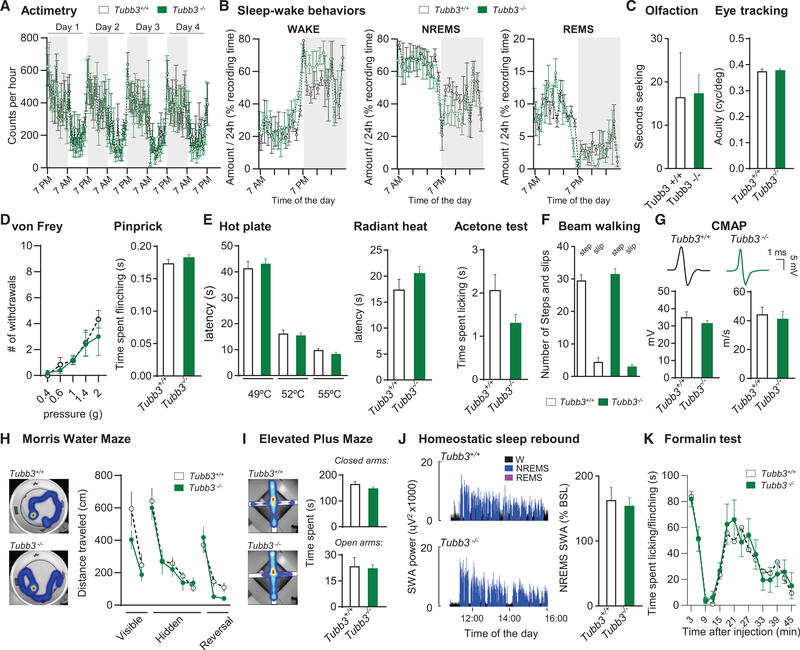
Figure 2. Tubb3−/− Mice Have No Behavioral Defects.
(A) Actimetry of wild-type and Tubb3/ mice over a 4-day period (N = 6 or 6+/+, 6−/−).
(B) Wake, non-rapid eye movement (NREM), and rapid eye movement (REM) sleep amount expressed as percentage of the recording time in wild-type and Tubb3−/− mice (N = 4+/+, 4−/−).
(C) Olfactory discrimination (left) measured as seconds to nose touch with bacon-flavored softie. Visual acuity (right) assessed by eye tracking assay. (Olfaction: N = 8+/+, 8−/−; visual acuity: N = 10+/+, 10−/−).
(D) Number of brisk withdrawals out of 10 stimulations at various pressures applied onto the plantar surface of the hindpaw (left) or in the pinprick test (right) (N = 10+/+, 16−/−).
(E) Latency of withdrawal to contact heat at 49, 52 and 55C (left) and to a radiant heat source (middle). Time spent licking/flinching in the acetone test (right) (N = 10+/+, 16−/−).
(F) Balance beam assay for number of steps (columns 1 and 3) and slips (columns 2 and 4) (N = 10+/+, 13−/−).
(G) Representative compound muscle action potential (CMAP) recordings from intraplantar muscles evoked by sciatic nerve stimulation in wild-type and Tubb3−/− mice and quantification of CMAP intensity and velocity (N = 6+/+, 6−/−).
(H) Distance traveled in the visible, hidden and reversal phases of the water Morris maze assay (N = 8+/+, 13−/−). Inset: representative heatmap of the time spent during the hidden phase.
(I) Heatmap representation of time spent in closed/open arms in the elevated plus maze assay and quantification (s) (N = 16+/+, 17−/−).
(J) Representative traces of the time course of SWA (slow wave activity; spectral electroencephalogram (EEG) power in the 0.5- to 4.0-Hz range) during the first2.5 h of sleep opportunity in wild-type (top) and Tubb3/ (bottom) mice. Right: NREMS SWA computed over 4 hr (11:00–15:00) expressed as a percentage of the 24-hr baseline mean (N = 4+/+, 4−/−).
(K) Time spent licking/flinching the paw after intraplantar injection of formalin (1%) (N = 6+/+, 6−/−).
Error bars indicate SEM. See also Figure S2.

