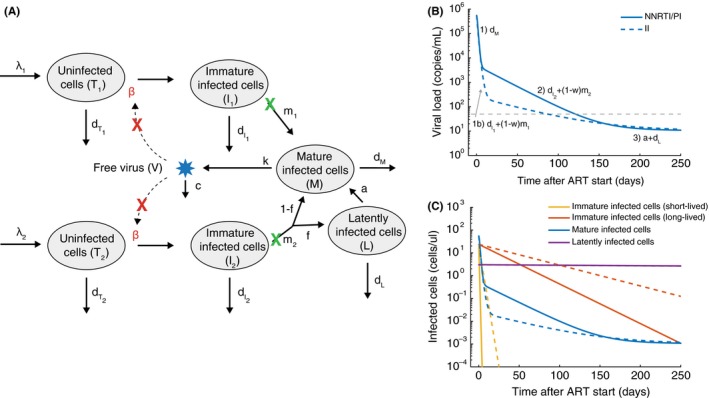
Figure 3.

Multiphasic viral load decay under antiretroviral therapy suggests more complex infection dynamics. (A) A schematic of an augmented viral dynamics model that has emerged from various studies of viral load dynamics during therapy.55, 56, 57, 58, 59, 66, 68 Most drugs inhibit the ability of virus to infect new cells (red X). Two separate populations of target cells are hypothesized to exist, with the second type (T 2 , I 2) being longer lived and proceeding to integrate virus more slowly. Infected cells of either type can be divided up into those who have not yet completed the phase of the viral lifecycle where integration occurs (“Immature”, I i), and those who have (“Mature”, M), which allows investigation of different dynamics in the presence and absence of integrase inhibitor drugs (green X). Some infected cells transition to an extremely long‐lived latent state (L). (B) Viral load decay with and without integrase inhibitors (II) (commonly used alternative drugs are protease inhibitors (PI) and nonnucleoside reverse‐transcriptase inhibitors (NNRTI)). Labels above phases of decay show the parameter combinations responsible for each phase. (C) Dynamics of the different infected cell combinations predicted by the model. Dotted vs dashed lines have same meaning as in B. The model was created by combining conclusions from various papers. Values for parameters are also taken approximately from these studies: λ 1 = 100 cells/uL/d, β = 3× 10⁻⁷/(virus/mL)/d, = .36/d, m 1 = 2.6/d, λ 2 = 1 cells/uL/d, = .02/d, m 1 = .02/d, f = 10−2, a = 4× 10⁻⁴/d, dL = 10−4/d, d m= 1/d, k = 250 virus/cell/d, c = 25/d. With treatment with NNRTI or PI, β → 0, and for treatment with II, m → m(1 − ω) and the treatment efficacy where ω = .95.
