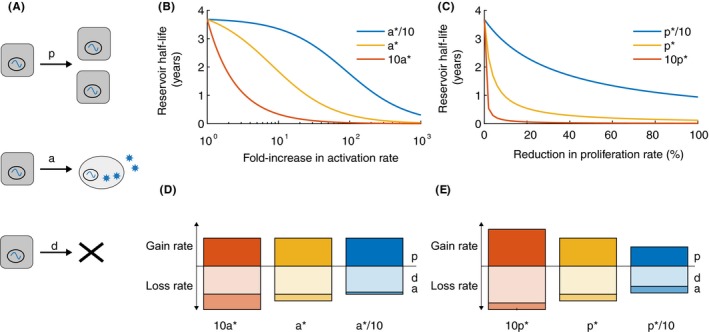
Figure 7.

Dynamics of the latent reservoir during antiretroviral therapy in response to hypothetical treatments. (A) Diagram of the three main processes thought to impact the population of latently infected cells during therapy: cell proliferation (p), reactivation (a), and death (d). (B/C). Changes in the half‐life of the latent reservoir when therapies are administered that perturb one of the parameters. Calculated using Equation [Link], where half‐life = log(2)/ δ, δ = d + a − p. Baseline parameter values, taken from Reeves et al., are a* = 5.7× 10⁻⁵/d, p* = .015/d, and d* = .0155/d, δ = 5.2e − 4/d, half‐life = 44 months or 3.7 years (yellow lines). Red and blue lines are for alternate parameter sets. B) Hypothetical therapy that increases the activation rate (a) of latently infected cells during ART. When pretherapy a is varied (to 10a* or a*/10), p is kept constant at p* but d is adjusted to keep δ the same. (C) Hypothetical therapy that decreases the proliferation rate (p) of latently infected cells during ART. When pretherapy p is varied (to 10p* or p*/10), a is kept constant at a* but d is adjusted to keep δ. the same. (D/E) Comparison of the relative magnitude of dynamic rates for the corresponding scenarios in the figure above. The height of the bar is proportional to the log10 of the value of the rate. The bar above the horizontal axis represents the process that contributes to reservoir increase (“gain rate”, p) whereas bars below are processes that contribute to reservoir decay (“loss rate”, a, d).
