Figure 8.
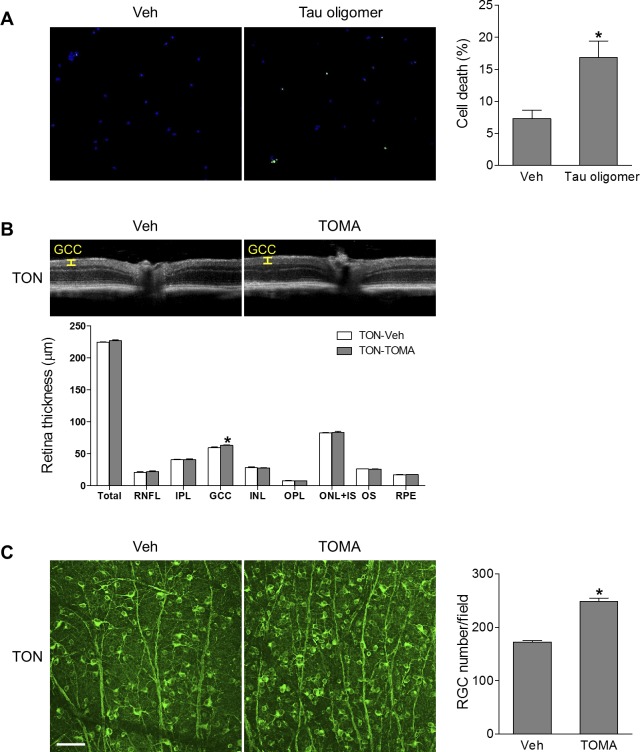
Tau oligomers are involved in RGC death. (A) Isolated primary mouse RGCs were exposed to Tau oligomers (100 ng/mL) or vehicle (Veh) for 24 hours followed by TUNEL assay. Green fluorescence reflects TUNEL-positive cells and blue fluorescence (DAPI) labels nuclei. Bar graph represents the percentage of apoptotic RGCs, calculated as the ratio of the number of TUNEL-positive cells to the total number of DAPI-stained nuclei. Eighteen fields were counted in each group; n = 3 independent experiments. *P < 0.05 versus Veh. (B, C) WT mice were intravenously injected with vehicle (IgG) or TOMA (30 μg/mouse) 1 hour before TON. (B) OCT analysis was conducted for retinal thickness 7 days after TON, and representative images are shown. Yellow lines indicate the GCC (composed of the RNFL, GCL, and IPL). Bar graph represents the thickness of total retina, individual retinal layers, and the GCC. IPL, inner plexiform layer; IS, inner segment; OPL, outer plexiform layer; OS, outer segment; RNFL, retinal nerve fiber layer. (C) Images of retinal flatmounts labeled with anti-Tuj-1 antibody (green). Bar graph represents the number of Tuj-1–positive cells per field. n = 6, *P < 0.05 versus Veh. Scale bar: 50 μm.

