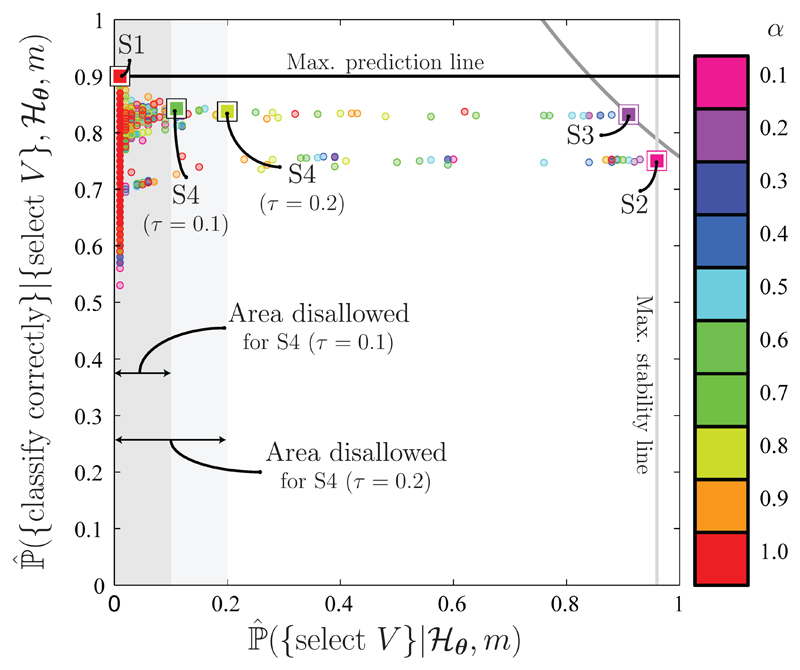
Figure 2.
Illustration of the differences between the joint strategies (S1 – S4). The round markers correspond to different covariates sets (of various sizes) returned by 10 different models, , when applied to one of the simulated datasets of Section 3.1. Each model corresponds to a different value of α (see Section 2.4), hence the colours of the markers indicate the model that was used to select each covariate set. The larger, labelled markers correspond to the final sets of selections returned by strategies S1 – S4 (as indicated). S1 returns the set, V, that maximises predictive performance, regardless of how stably it is selected; S2 returns the most stably selected set, regardless of the predictive performance it offers; S3 seeks a compromise between stability and predictive performance; and S4 returns the most predictive covariate set, subject to a stability threshold, τ.

