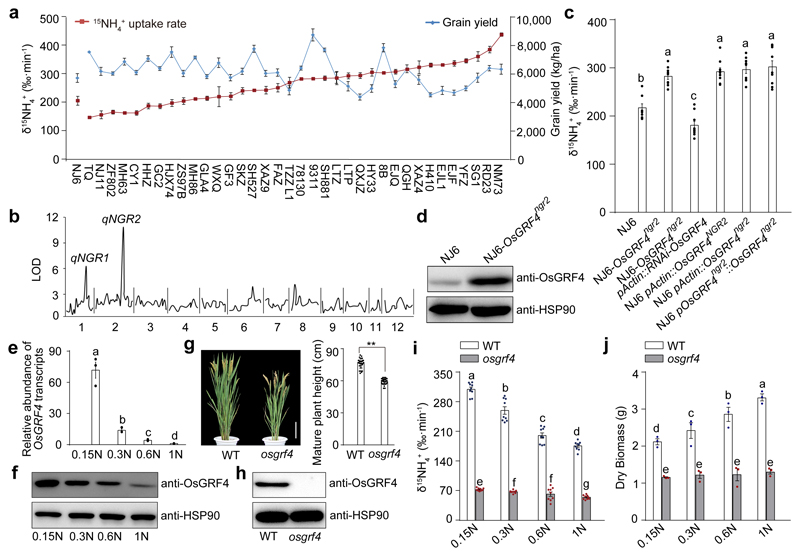
Figure 2. OsGRF4 regulates rice NH4+ uptake and growth response to N availability.
a, Variation in 15NH4+ uptake and grain yield. 4-week-old rice plants (15NH4+ uptake assays) were grown hydroponically with high N supply (1.25 mM NH4NO3). Data shown as mean ± s.e.m. (n = 6). Field-grown rice plants (yield assays) were grown with urea supply (210 kg/ha). Data shown as mean ± s.e.m. of six plots (each plot contained 220 plants) per line. b, QTL analysis. c, 15NH4+ uptake rate. d, Accumulation of OsGRF4. e, OsGRF4 transcript abundance in NJ6 roots grown in increasing N supply (0.15N, 0.1875 mM NH4NO3; 0.3N, 0.375 mM NH4NO3; 0.6N, 0.75 mM NH4NO3; 1N, 1.25 mM NH4NO3). Transcription relative to that of 1N (set to one). f, Accumulation of OsGRF4 in NJ6. g, Mature plant height of the rice osgrf4 mutant (Extended Data Fig. 1a). Scale bar, 15 cm. Data shown as mean ± s.e.m. (n = 20). ** P < 0.05 as compared to WT group by two-sided Student’s t-test. h, Accumulation of OsGRF4. HSP90 serves as loading control (panels d, f and h). i, 15NH4+ uptake rate. Data (c, i) shown as mean ± s.e.m. (n = 9). j, Dry weight of 4-week-old plants. Data (e, j) shown as mean ± s.e.m. (n = 3). Different letters denote significant differences (P < 0.05; panels c, i and j; Duncan's multiple range test). The pictures represent one of the three experiments performed independently with similar results (panels b, d, f and h).

