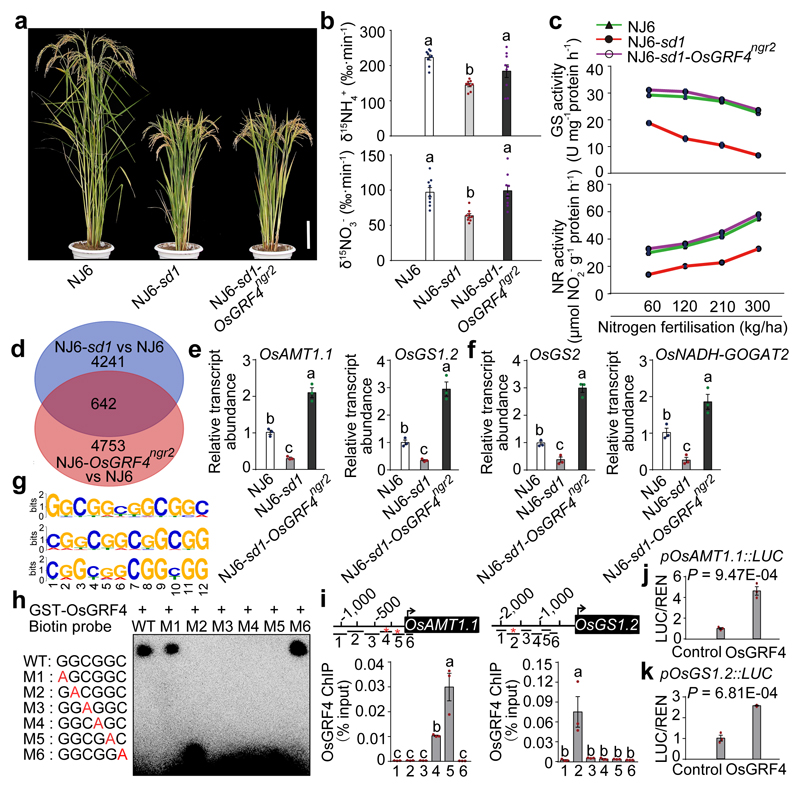
Figure 3. OsGRF4 regulates expression of multiple N metabolism genes.
a, Mature plants. Scale bar, 15 cm. b, 15NH4+ and 15NO3- uptake rates. Data shown as mean ± s.e.m. (n = 9). c, Glutamine synthase (GS) and nitrate reductase (NR) activities in shoots of rice plants grown in paddy-field conditions with increasing urea supply. d, RNA-seq analysis. 4883 genes had transcript abundances down-regulated in NJ6-sd1 (versus NJ6; blue), 5395 genes had transcript abundances up-regulated in NJ6-OsGRF4ngr2 (versus NJ6; orange), with 642 genes common to both. e, f, Root (e) and shoot (f) mRNA abundances relative to NJ6 (set to one). g, Sequence motifs enriched in ChIP-seq with Flag-tagged OsGRF4. h, EMSA assays. The pictures (a, h) represent one of the three experiments performed independently with similar results. i, Flag-OsGRF4 mediated ChIP-PCR enrichment (relative to input) of GCGG-containing promoter fragments (marked with *) from OsAMT1.1 and OsGS1.2. Different letters denote significant differences (P < 0.05; panels b, e, f and i; Duncan's multiple range test). j, k, Transactivation assays. Data (c, e-f, i and j-k) shown as mean ± s.e.m. (n = 3). A two-sided Student’s t-test was used to generate the P values.

