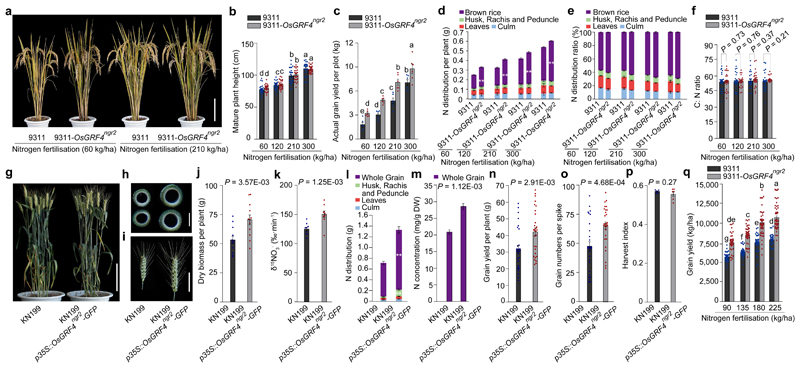
Figure 5. Elevated OsGRF4 abundance increases grain yield and NUE of rice and wheat GRVs without increasing mature plant height.
a, Appearance of mature plants. Scale bar, 15 cm. b, Plant height. c, Grain yield. Data shown as mean ± s.e.m. of six plots (each plot contained 220 plants) per line per N level. d, e, N distribution per plant (d) and ratio (%; e) of plants shown in b. ** P < 0.05, 9311-OsGRF4ngr2 compared with 9311 by two-sided Student’s t-test (panels d and e). f, C:N ratio of plants shown in b. Data (b, d-f) shown as mean ± s.e.m. (n = 30). g, Mature wheat plant morphology. Scale bar, 15 cm. h, Cross section of the uppermost internode of (left) KN199 and (right) KN199 p35S::OsGRF4ngr2-GFP wheat plants. Scale bar, 2 mm. i, Spike length. Scale bar, 5 cm. The pictures represent one of the three experiments performed independently with similar results (panels a, g-i). j, Biomass accumulation. Data shown as mean ± s.e.m. (n = 12). k, 15NO3- uptake rate. l, N distribution. Data (k, l) shown as mean ± s.e.m. (n = 9). ** P < 0.05, KN199 p35S::OsGRF4ngr2-GFP compared with KN199 by two-sided Student’s t-test. m, N concentrations. Data shown as mean ± s.e.m. (n = 20). n, Grain yield. o, Grain number. Data (n, o) shown as mean ± s.e.m. (n = 30). p, Harvest index. Data shown as mean ± s.e.m. (n = 6). A two-sided Student’s t-test was used to generate the P values (panels f, j-k and m-p). q, Overall grain yield. Data shown as mean ± s.e.m. (n = 60). Different letters denote significant differences (P < 0.05; panels b, c and q; Duncan's multiple range test).

