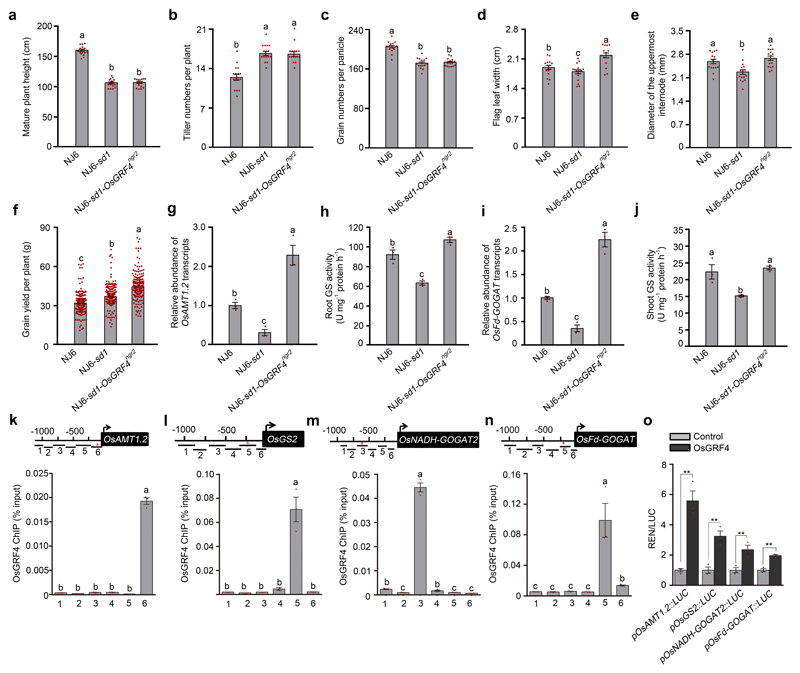
Extended Data Figure 2. Comparisons NJ6, NJ6-sd1 and NJ6-sd1-OsGRF4ngr2 isogenic line traits reveals that OsGRF4 regulates expression of NH4+ metabolism genes.
a, Mature plant height. Data shown as mean ± s.e.m. (n = 16). Different letters denote significant differences (P < 0.05, Duncan's multiple range test). b, The number of tillers per plant. c, The number of grains per panicle. Data shown as mean ± s.e.m. (n = 16). Different letters denote significant differences (P < 0.05, Duncan's multiple range test). d, Flag-leaf width. Data shown as mean ± s.e.m. (n = 16). Different letters denote significant differences (P < 0.05, Duncan's multiple range test). e, Culm (stem) width expressed as diameter of the uppermost internode. Data shown as mean ± s.e.m. (n = 16). Different letters denote significant differences (P < 0.05, Duncan's multiple range test). f, Grain yield per plant. Data shown as mean ± s.e.m. (n = 220). Different letters denote significant differences (P < 0.05, Duncan's multiple range test). g, Relative root abundance of OsAMT1.2 mRNA in NILs, genotypes as indicated. Abundance shown relative to that in NJ6 plants (=1). Data shown as mean ± s.e.m. (n = 3). Different letters denote significant differences (P < 0.05, Duncan's multiple range test). h, Root glutamine synthase (GS) activities. Data shown as mean ± s.e.m. (n = 3). Different letters denote significant differences (P < 0.05, Duncan's multiple range test). i, Relative shoot abundance of OsFd-GOGAT mRNA. Abundance shown relative to that in NJ6 plants (=1). Data shown as mean ± s.e.m. (n = 3). Different letters denote significant differences (P < 0.05, Duncan's multiple range test). j, Shoot glutamine synthase (GS) activities. Data shown as mean ± s.e.m. (n = 3). Different letters denote significant differences (P < 0.05, Duncan's multiple range test). k-n, Flag-OsGRF4 mediated ChIP-PCR enrichment (relative to input) of GCGG-containing promoter fragments (marked with *) from OsAMT1.2, OsGS2, OsNADH-GOGAT2 and OsFd-GOGAT promoters. Diagrams depict putative OsAMT1.2, OsGS2, OsNADH-GOGAT2 and OsFd-GOGAT promoters and fragments (1-6). Data shown as mean ± s.e.m. (n = 3; panels k-n). Different letters denote significant differences (P < 0.05, Duncan's multiple range test). o, OsGRF4 activates pOsAMT1.2, pOsGS2, pOsNADH-GOGAT2 and pOsFd-GOGAT promoter::Luciferase fusion constructs in transient transactivation assays. Data shown as mean ± s.e.m. (n = 3). ** P < 0.05 as compared to control group by two-sided Student’s t-tests.

