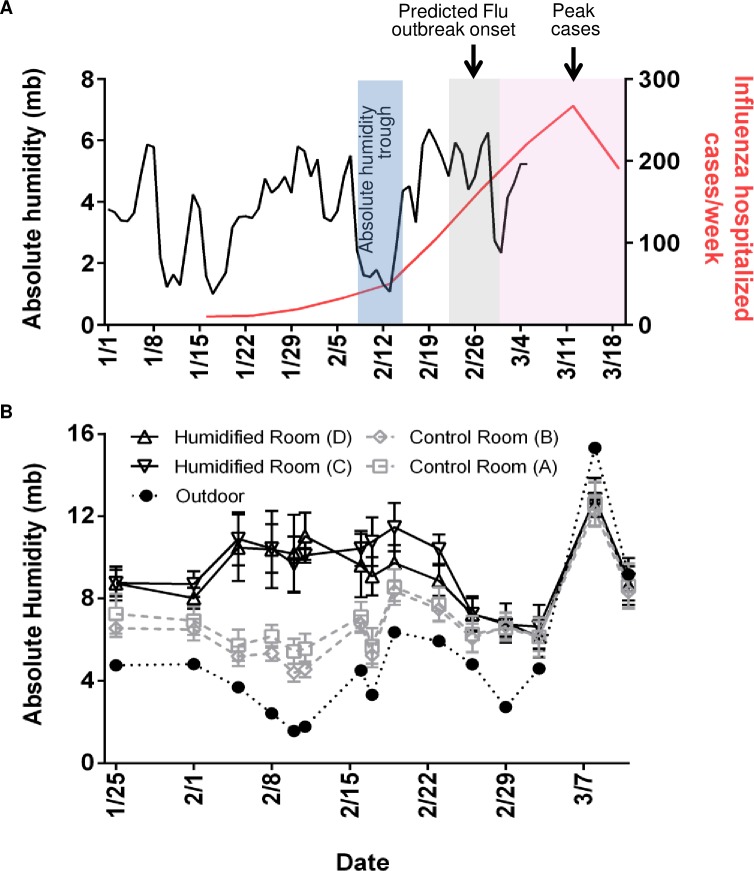
Fig 1. Absolute humidity and influenza hospitalized cases.
(A) Outdoor absolute humidity (AH) values (n = 65; one measurement per day) from Rochester, MN and influenza hospitalized cases in MN (n = 1070, week ending in January 16th- March 19th). Applying the national trend model described by Shaman et al.[34] to the local humidity and illnesses, onset of influenza followed the predicted delay of 10–16 days (grey box) after an absolute humidity trough (blue box). Peak cases follow (pink box), as there is an incubation period of 1–4 days with viral shedding up to 7 days after symptoms resolve. (B) AH in 4 preschool classrooms (average of two sensors from 10 minute intervals over 150 minutes (n = 16 per sensor, room D) or (n = 17 per sensor, rooms A,B, C) per class period per sensor). Center values are mean of both sensors during class time and error bars are s.d. and corresponding outdoor AH (n = 15, 1 per day) on the 15 days of sample collection. Humidifiers were running in humidified rooms through sample collection on February 23.

