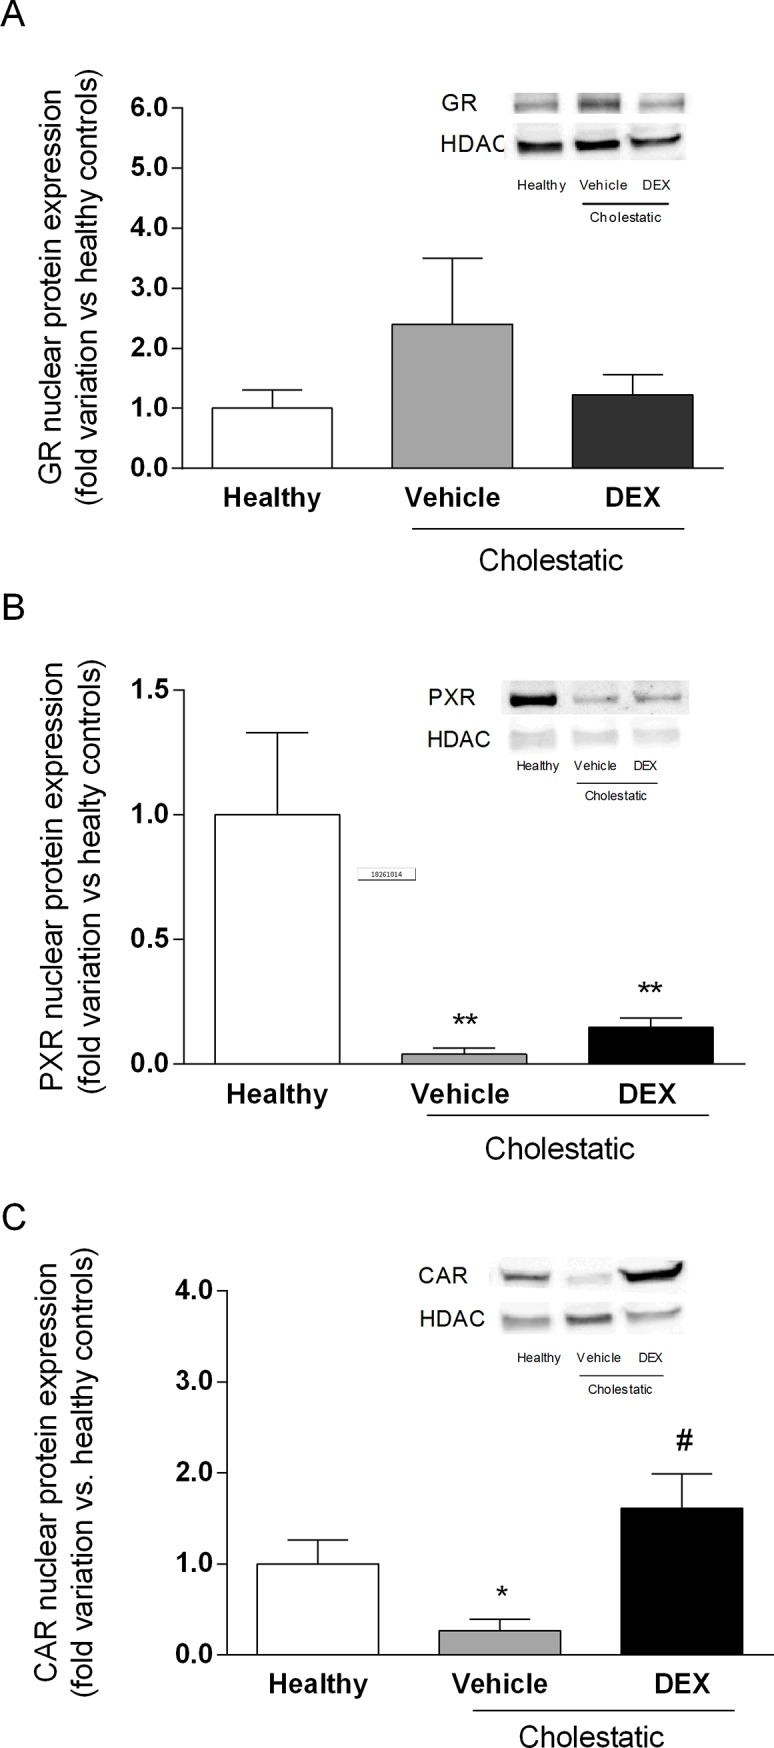
Fig 4. NR activation in rat livers.

Densitometric analysis of the immunoreactive bands of: (A) GR nuclear protein expression; (B) PXR nuclear protein expression; and (C) CAR nuclear protein expression. A representative Western blot experiment showing NR nuclear protein expression is shown on the right of each graph. HDAC was used as loading control. Data are expressed as mean ± SEM. ANOVA followed by the Neuman-Keuls post-hoc test. *P < 0.05, **P < 0.01 vs healthy rats; #P < 0.05 vs cholestatic rats treated with vehicle.
