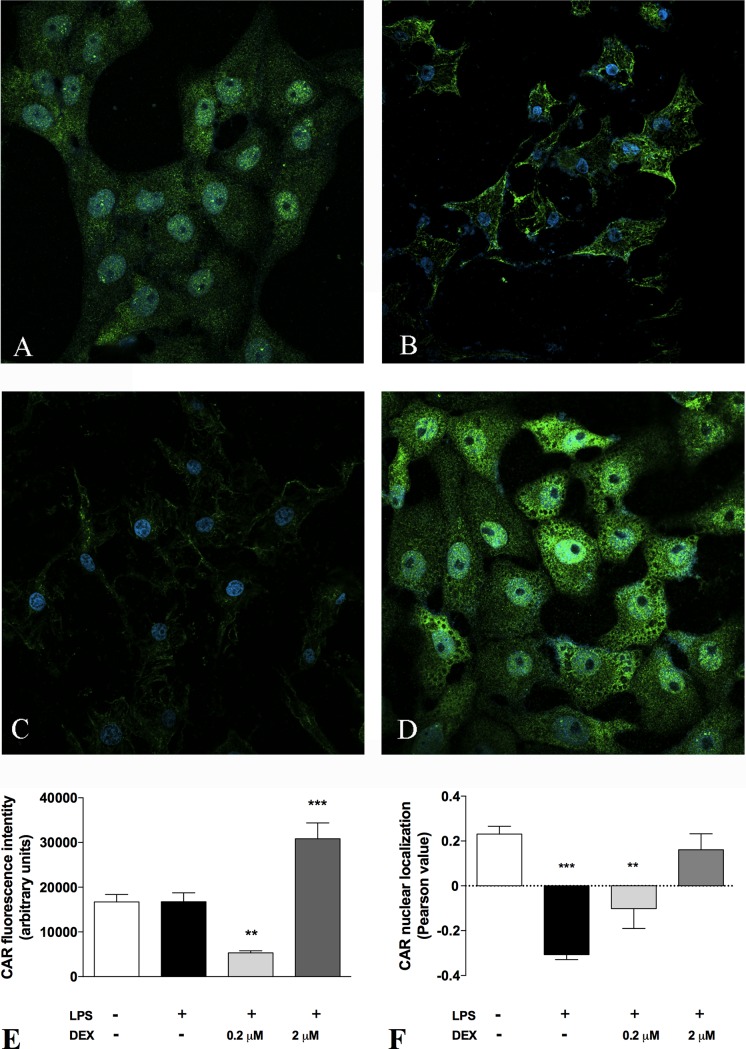
Fig 5. Immunofluorescence staining of CAR in HepG2 cells.
Immunostaining for the CAR after incubation in basal condition (control), with 10 μg/ml LPS for 24h, 0.2 μM DEX + 10 μg/ml LPS for 24h and 2 μM DEX + 10 μg/ml LPS for 24h. Values are means ± S.E.M. (n = 10). The histograms report the intensity of fluorescence (arbitrary units). Representative images from five independent experiments are shown. Cell nuclei are stained blue with DAPI. ANOVA followed by the Dunnett post-hoc test. *P < 0.05; ***P < 0.001 vs control.

