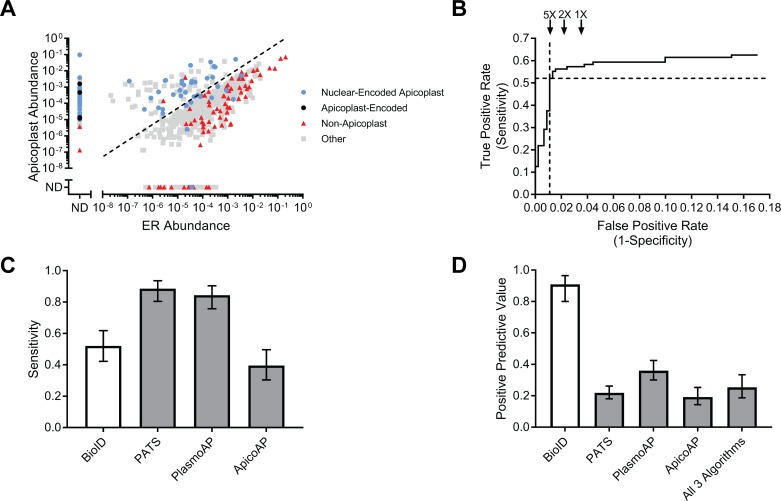
Fig 2. Accurate, unbiased identification of apicoplast proteins using BioID.
(A) Abundances of 728 proteins identified by mass spectrometry in BioID–Ap and BioID–ER parasites. Protein abundances were calculated by summing the total MS1 area of all matched peptides for a given protein and normalized by the total summed intensity of all P. falciparum peptides matched. Dotted line represents 5-fold apicoplast:ER enrichment. (B) ROC curve used to identify the apicoplast:ER enrichment that maximized true positives while minimizing false positives. Dotted lines denote the sensitivity and false positive rate of the 5-fold cutoff used. False positive rates for hypothetical 2-fold and 1-fold enrichments are shown for reference. (C) Sensitivities of BioID, PATS, PlasmoAP, and ApicoAP based on identification of 96 known apicoplast proteins. (D) PPV of BioID, PATS, PlasmoAP, ApicoAP, and a data set consisting of proteins predicted to localize to the apicoplast by all 3 bioinformatic algorithms. Calculated as the number of true positives divided by the total number of true positives and false positives. Error bars in (C) and (D) represent 95% confidence intervals. Tabulated data are available in S1 Data. ApicoAP, Apicomplexan Apicoplast Proteins algorithm; BioID, proximity-dependent biotin identification; ER, endoplasmic reticulum; ND, not detected; PlasmoAP, Plasmodium falciparum Apicoplast-targeted Proteins algorithm; PATS, Predict Apicoplast-Targeted Sequences algorithm; PPV, positive predictive value; ROC, receiver operating characteristic.

