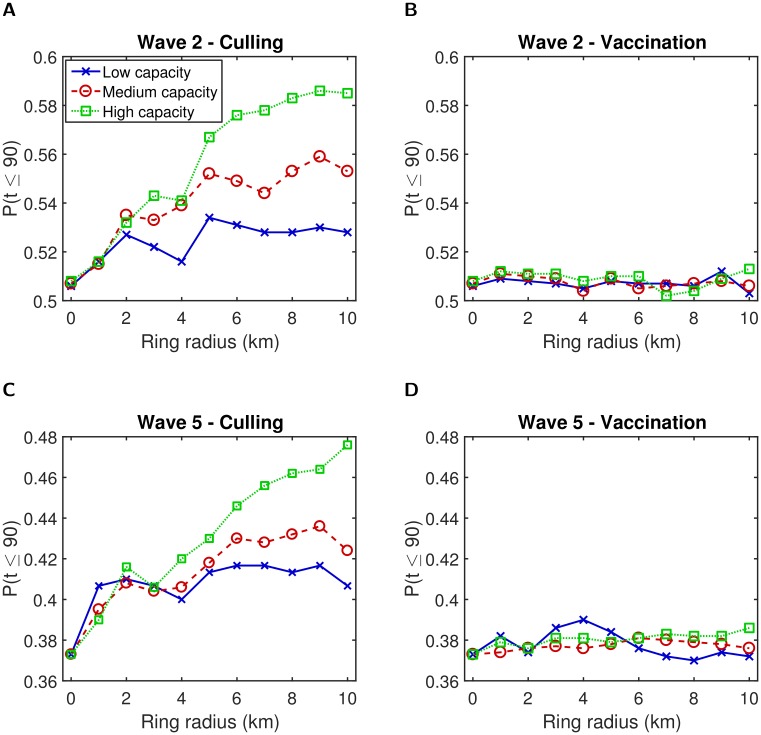
Fig 6. Predicted probability of outbreak duration (t) being 90 days or less for different ring culling and vaccination radii.
For each transmission model and control method combination, the three capacity settings of interest, low (solid blue line, crosses), medium (dashed red line, circles), and high (dotted green line, squares) displayed disparate behaviour. (A) Wave 2—culling; (B) wave 2—vaccination; (C) wave 5—culling; (D) wave 5—vaccination. In all panels a ring size of 0km corresponds to a control action of culling infected premises only. Results are averaged over 1,000 simulations and 500 simulations for wave 2 and wave 5 type transmission dynamics respectively.

