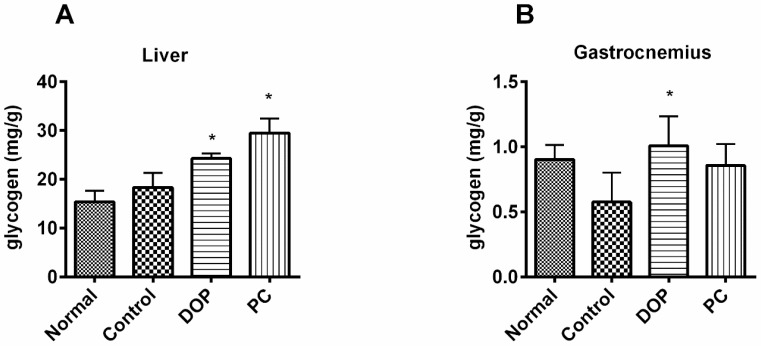
Figure 5.
Effects of DOP and Rhodiola extract on liver glycogen (A) and gastrocnemius glycogen (B) after weight-loaded swimming test. Values are expressed as the mean ± SD (n = 8). * p < 0.05, compared with the control group. Normal group means mice unexposed to the weight-loaded swimming test. Control group means mice exposed to the weight-loaded swimming test and treated with distilled water. PC means positive control, and mice of this group were treated with Rhodiola extract.

