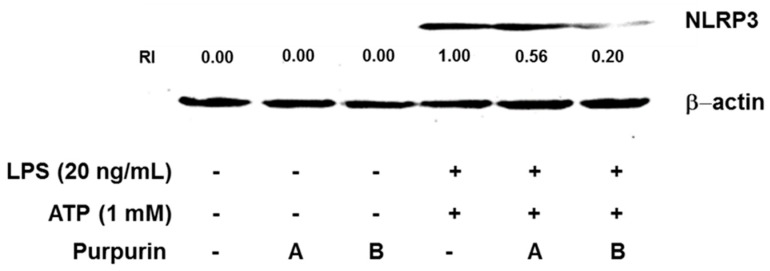
Figure 4.
Western blot analysis for determination of regulatory effect of purpurin on NLRP3 expression in activated RAW 264.7 murine macrophage cells. The cells, consecutively stimulated with LPS for 3 h and then ATP for 30 min, were treated with various concentrations of purpurin for 30 min: A, 10 μM; B, 50 μM. Total cell lysates were prepared and subjected to Western blot. RI (relative intensity) was defined as the ratio of band intensity of target protein to those of β-actin. The blot pattern is representative of three independent experiments.

