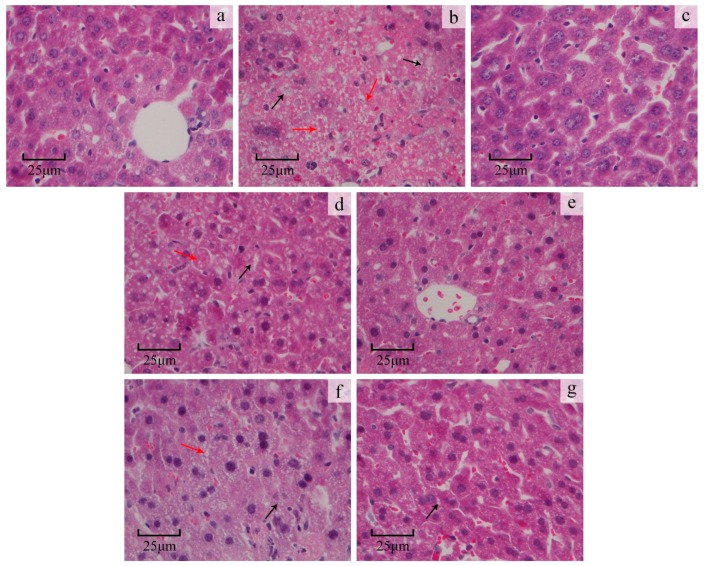
Figure 5.
Effects of ORWP and ORAP on liver as disclosed by morphological analysis (×400 H&E staining). (a) normal control group; (b) CCl4-intoxicated group; (c) bifendate positive control group (200 mg/kg) + CCl4; (d) ORWP (100 mg/kg) + CCl4; (e) ORWP (200 mg/kg) + CCl4; (f) ORAP (100 mg/kg) + CCl4; (g) ORAP (200 mg/kg) + CCl4. Black arrows indicate necrotic zones; red arrows indicate lipid droplet accumulation.

