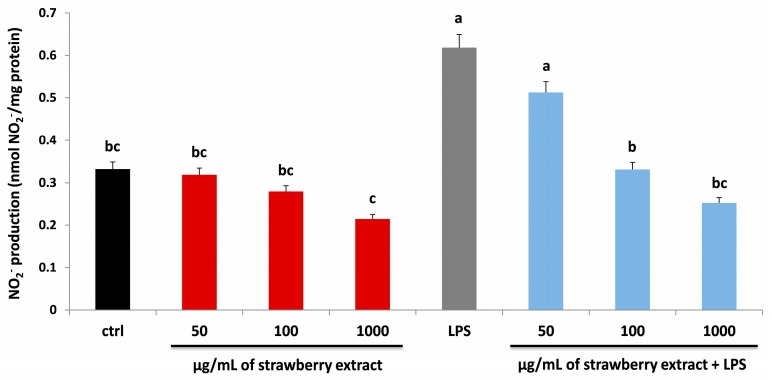
Figure 5.
NO2− production in HDF cells treated with different concentrations of strawberry extracts (50, 100, 1000 µg/mL) for 24 h (red bars), LPS (10 µg/mL) for 24 h (grey bar) and with different concentrations of strawberry extracts and then with LPS (blue bars). Black bar represents the control group. Data are expressed as mean values ± SD. Columns with different superscript letters are significantly different (p < 0.05).

