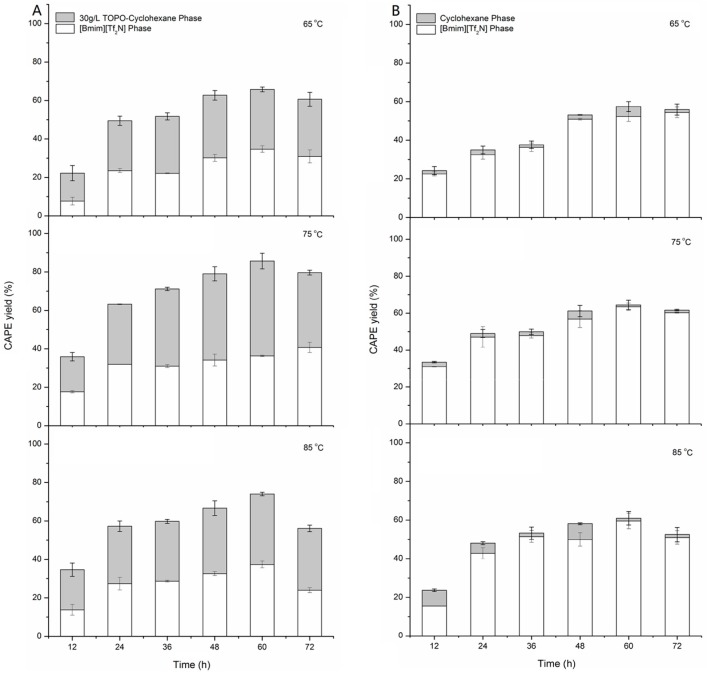
Figure 3.
Comparison of CAPE yield from MC and PE via transesterification using equivoluminal 30 g/L TOPO-cyclohexane/[Bmim][Tf2N] (A) and cyclohexane/[Bmim][Tf2N] (B) at different temperatures. The upper histogram shows the yield of CAPE in the solvent phase; the lower histogram shows the yield of CAPE in the ionic liquid (IL phase); and the total CAPE yield is the sum of the upper and lower yields. Conditions: mass ratio of MC to Novozym 435 = 1:20, molar ratio of MC to PE = 1:15, MC concentration = 10 g/L, 180 rpm for 72 h. Each value is expressed as the mean ± standard deviation (n = 3).

