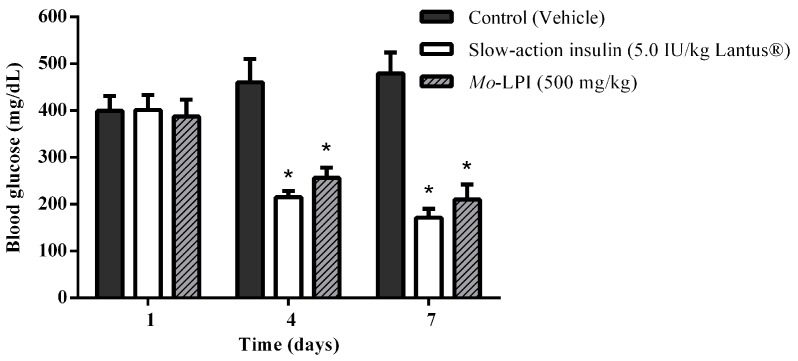
Figure 7.
Effect of Mo-LPI on blood glucose level after seven consecutive days of intraperitoneal administration to alloxan-induced diabetic mice. Values are means ± S.E.M. (n = 10). Control: vehicle (0.05 M Tris-HCl, pH 7.5, 0.15 M NaCl). * Significant (p < 0.01) difference when compared with the corresponding value of the diabetic control.

