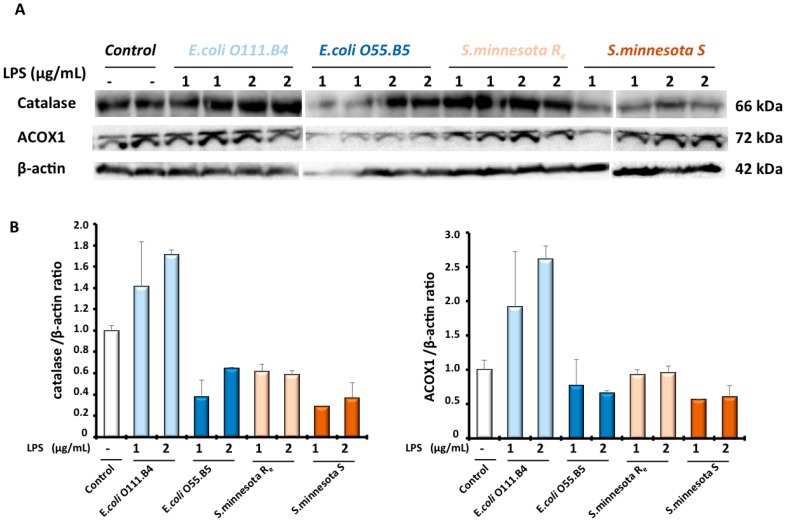
Figure 4.
Expression levels of ACOX1 and catalase proteins were evaluated by Western blotting analysis in BV-2 cell extracts after LPS treatment with the four different serotypes (1–2 µg/mL) for 24 h (A). Expression of protein was quantified by densitometry analysis and normalized to the β-actin; (B) and values represent the fold induction relative to the control.

