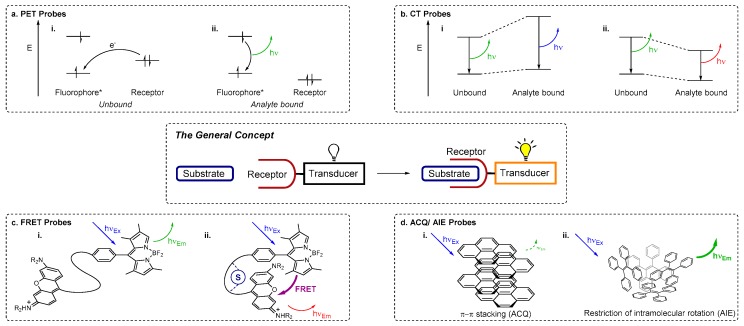
Figure 1.
Schematic representation of a receptor-substrate interaction transduced into a detectable signal (central panel) and the key concepts underpinning important mechanisms of fluorescence sensing. (a) Photoinduced Electron Transfer (PET): frontier orbital energy diagrams showing how (i) PET from the receptor quenches the fluorescence output of the fluorophore (the transducer); but (ii) when the substrate/analyte binds to the receptor, PET is inhibited and fluorescence emission turned on; (b) Charge Transfer (CT): frontier orbital diagrams representing the energy levels of CT systems and changes in emission wavelength due to (i) a reduced dipole moment (blue-shifted fluorescence emission) and (ii) an enhanced dipole moment (red-shifted fluorescence emission); (c) Förster Resonance Energy Transfer (FRET): (i) two π systems that are too far apart for FRET to occur in the absence of substrate; are (ii) brought into proximity when the substrate (S) binds, enabling the FRET process and triggering a change in the emission wavelength; (d) Aggregation Caused Quenching (ACQ) and Aggregation Induced Emission (AIE): schematic representations of (i) ACQ resulting from the stacking of pyrene units and (ii) AIE that occurs when the ‘rotors’ of hexaphenylsilole (HPS) interlock. See text for further discussion of these sensing mechanisms.

