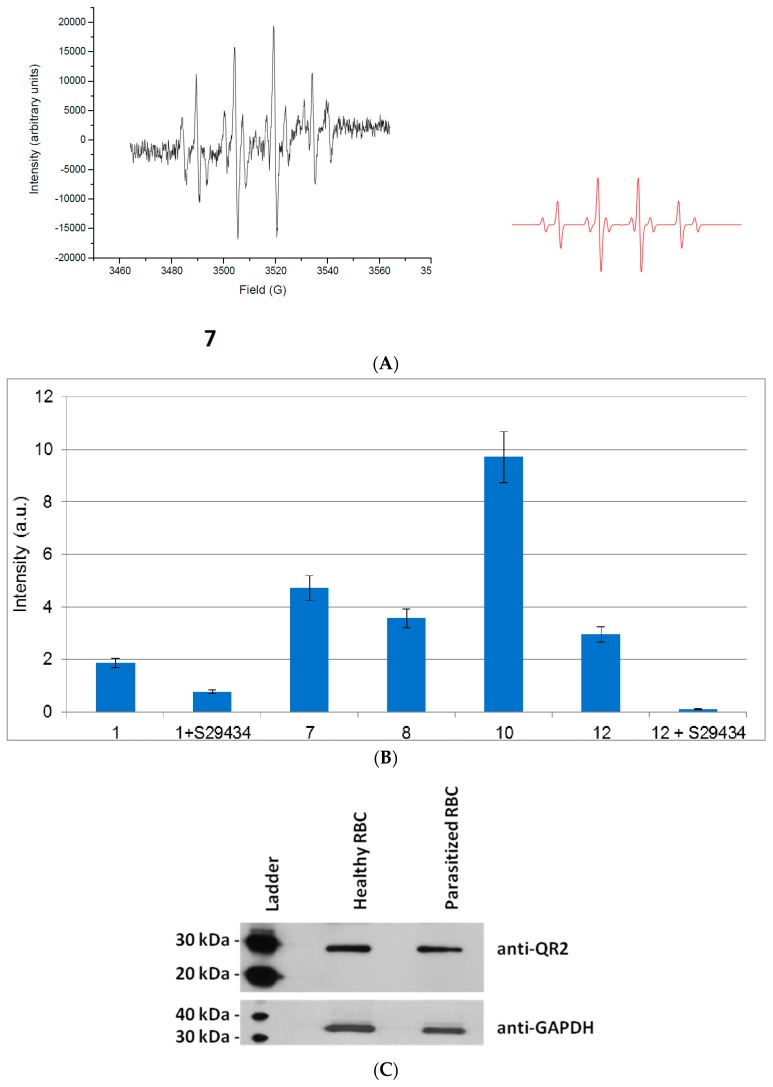
Figure 4.
Free radicals produced by metabolization of indolone derivatives in red blood cells. (A) EPR spectra recorded (left) after adding 7 to red blood cells, compared to the simulated spectrum (right, in red); (B) Comparison of reactive oxygen species (ROS) production for compounds selected from the two sets of active series. Cells (5 × 10⁶) in DPBS buffer were treated with an indolone derivative substrate (100 µM), N-benzyldihydronicotinamide BNAH (100 µM), and DMPO (50 mM) (6% DMSO in the final mix). ROS production was evaluated by double integration of the area under the peaks. In two cases, cells were pre-incubated with S29434 (20 µM) for 30 min before adding compounds 1 and 12; (C) Comparison of the expression of hQR2 expression in healthy versus parasitized red blood cells by western blot.

