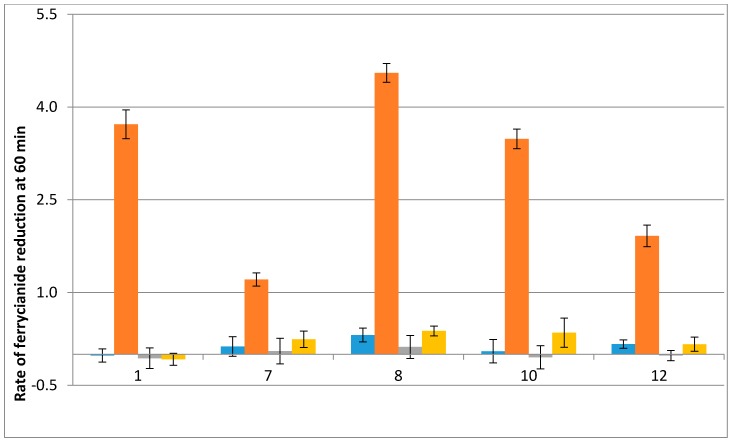
Figure 6.
Rates of ferricyanide reduction reflect the metabolization of indolone derivatives in CHO cells. Ferricyanide reduction rates were measured (mean % reduction ± SD) in two cell lines treated for 60 min with potassium ferricyanide (600 µM), BNAH (100 µM), and the indicated indolone substrates (100 µM). One cell line overexpressed hQR2 (CHO-QR2, orange bars) and the other was not transfected (CHO-NT, blue bars), and therefore, expressed only endogenous QR2 levels. The % reduction was evaluated by comparing absorbance in treated cells to the absorbance measured in the absence of substrates. Cells were pre-incubated for 24 h with the QR2 inhibitor S29434 (20 µM): CHO-QR2 + S29434, yellow bars; CHO-NT + S29434, grey bars.

