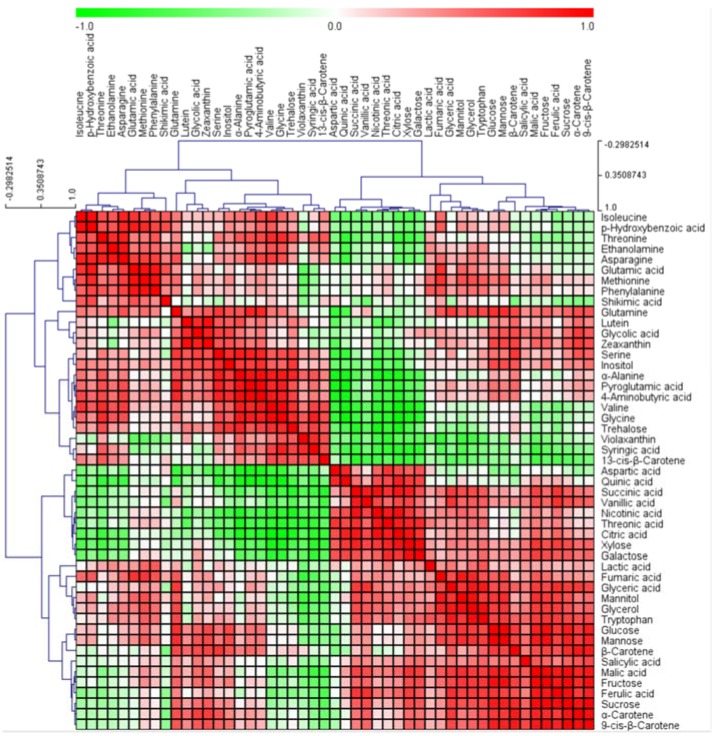
Figure 8.
Correlation matrix of 49 metabolites from six cultivars of marigold. Each square indicates r (Pearson’s correlation coefficient values of a pair of compounds). On the basis of the intensity of red and green colors, the value of correlation coefficient is reflected. Hierarchical clusters are represented by a cluster tree.

