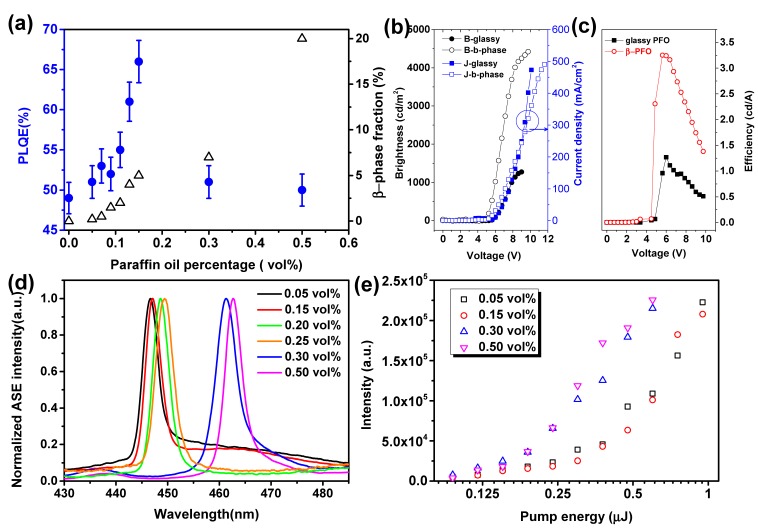
Figure 4.
(a) PLQE (filled circles) and β-phase fractions (open triangles) of PFO films as a function of paraffin oil volume percentage. (b) J–V–B curves and (c) the current efficiencies as a function of the input voltage for LEDs based on pristine PFO and mixed phase PFO films (β-phase fraction 2%). (d) ASE spectra of mixed phases PFO films spin-coated from various mixtures with paraffin oil volume percentages: 0.05, 0.15, 0.20, 0.25, 0.30, and 0.50 vol % (β-phase fraction 0.2, 5, 5.3, 5.7, 7, 20%). (e) Output intensity of films made from different paraffin oil mixtures is plotted as a function of the pump energy.

