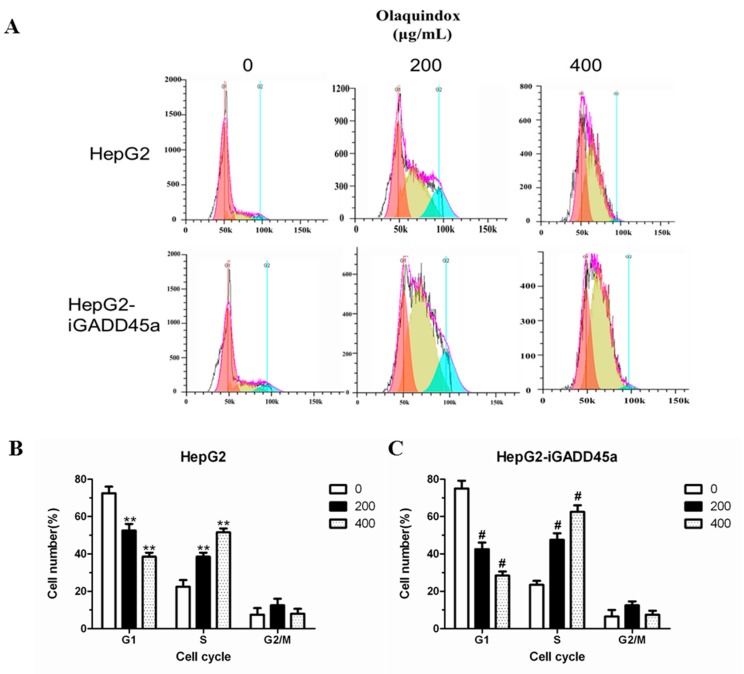
Figure 6.
Effects of GADD45a on the olaquindox induced cell cycle arrest. in HepG2 cells (A) HepG2 and HepG2-iGADD45a cells were treated with olaquindox (200 and 400 µg/mL, respectively) for 24 h; (B) Effect of olaquindox on cell cycle distribution of HepG2 cells; (C) Effect of olaquindox on cell cycle distribution of HepG2-iGADD45a cells. Samples were measured by a flow cytometer. A minimum of 20,000 cells were recorded from each experiment. All results were presented as mean ± SD and three independent experiments were carried out. (** p < 0.01, compared with the control; # p < 0.05, compared to HepG2 groups).

