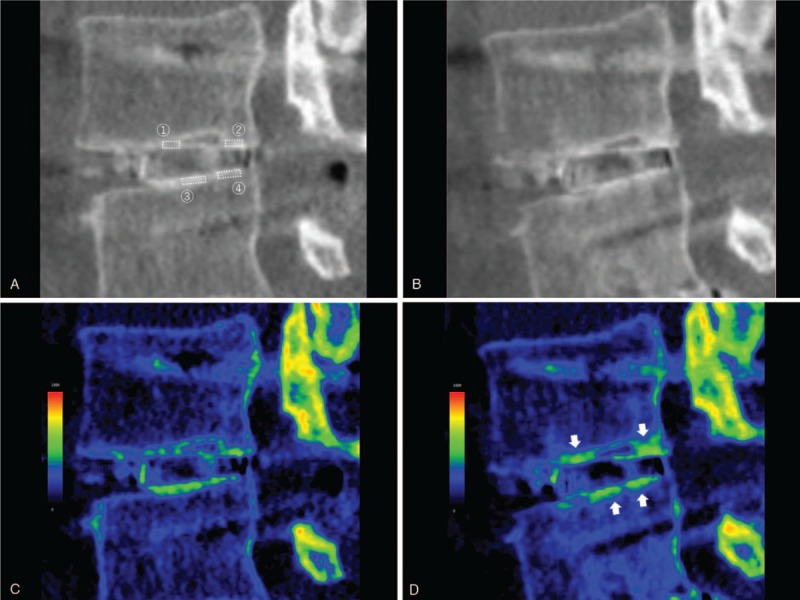
Figure 4.

CT in a 69-year-old man who underwent L3–L5 posterior lumbar interbody fusion. Sagittal reconstruction images at the same section at L3–L4 were shown. A, B: gray scale with a WW of 2000 HU and a WL of 300 HU within 1 week postoperatively (A) and 6 months postoperatively (B). C, D: color mapping with a WW of 1600 HU and a WL of 800 HU within 1 week postoperatively (C) and 6 months postoperatively (D). The postoperative local increase in HU values on the upper and lower surfaces of the cage frame, where the presence of bone ongrowth was suggested, could be recognized more easily by CT color mapping than conventional gray scale images (arrows). The ROI 1-4 represented the local ROIs where the postoperative bone ongrowth existed on the CT color mapping. CT = computed tomography, HU = Hounsfield unit, ROI = regions of interest, WL = window level, WW = window width.
