
Figure 3.
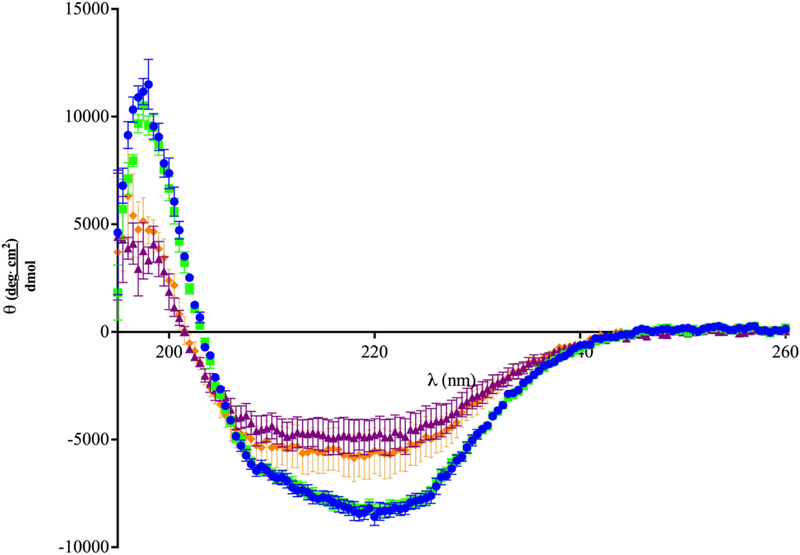
Structural Analysis of Recombinant Wild-type Dib1 and Dib1 L76A/D78A. CD spectra of wild-type (blue circles) and L76A/D78A (orange diamonds) Dib1 protein were taken from 195nm to 260nm at 30°C. Spectra for wild-type (green squares) and L76A/D78A (purple triangles) Dib1 were taken at 37°C. Data points are the average of three trials and error bars indicate one standard deviation.