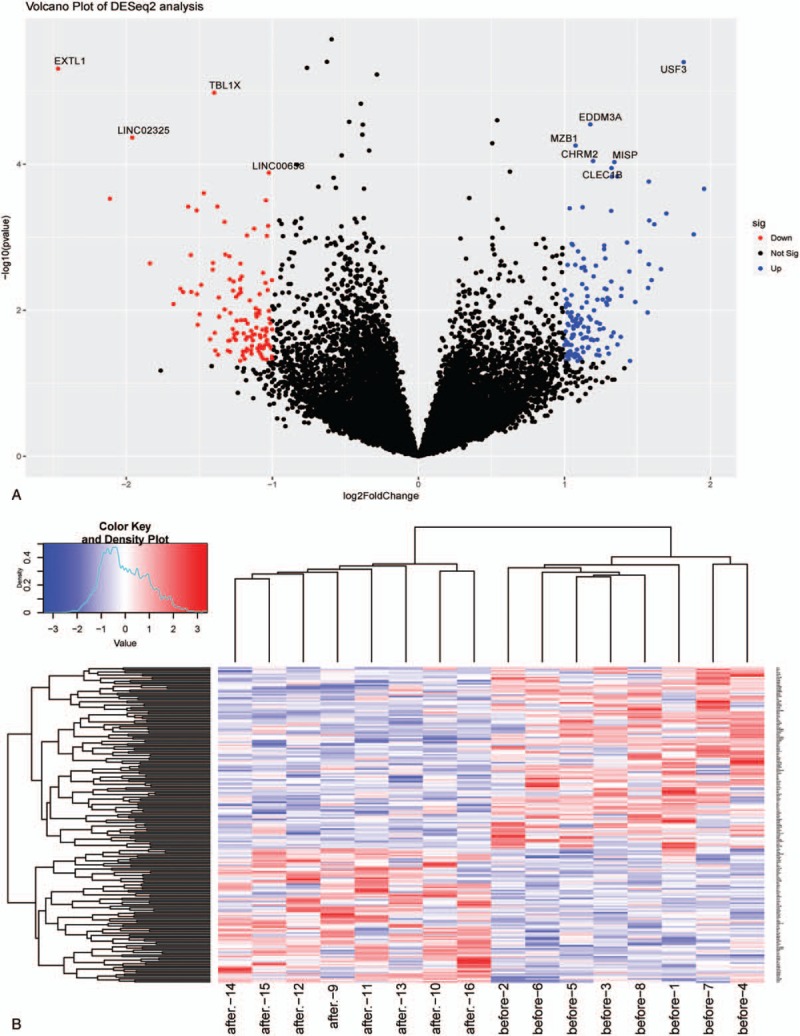
Figure 1.

Summaries of different expression for mRNA sequence data. [(A) Volcano and (B) heatmap plots of different expressed miRNAs. In the volcano plots, each red color dot represents a downregulated or upregulated mRNA. In the heatmap plots, each row representing a probe and each column representing a sample. Expression levels are depicted according to the color scale, shown at the top. The red color indicated high expressed mRNAs and the blue color indicated low expressed mRNAs, above and below the median, respectively. The magnitude of deviation from the median is represented by the color saturation.]
