
Figure 1.
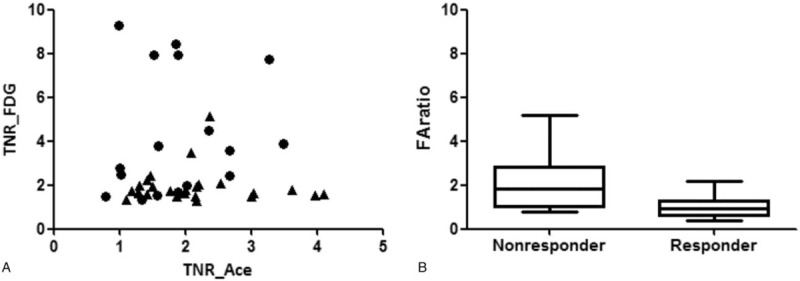
Values of TNR_FDG, TNR_Ace, FAratio in the patients, divided into responders and nonresponders after TACE. (A) Patients with high TNR_FDG and low TNR_Ace corresponded to the nonresponder group, and patients with low TNR_FDG and high TNR_Ace corresponded to the responder group. (B) Box plot of FAratio between the nonresponder and responder groups. Larger values of FAratio were observed in the nonresponder group compared with the responder group after TACE, with significant differences (P = .0006, Mann–Whitney U test). FAratio = ratio of TNR_FDG and TNR_Ace, TACE = transarterial chemoembolization, TNR_Ace = maximum tumor SUV to mean normal liver SUV ratio of 11C-acetate, TNR_FDG = maximum tumor SUV to mean normal liver SUV ratio of 18F-FDG.