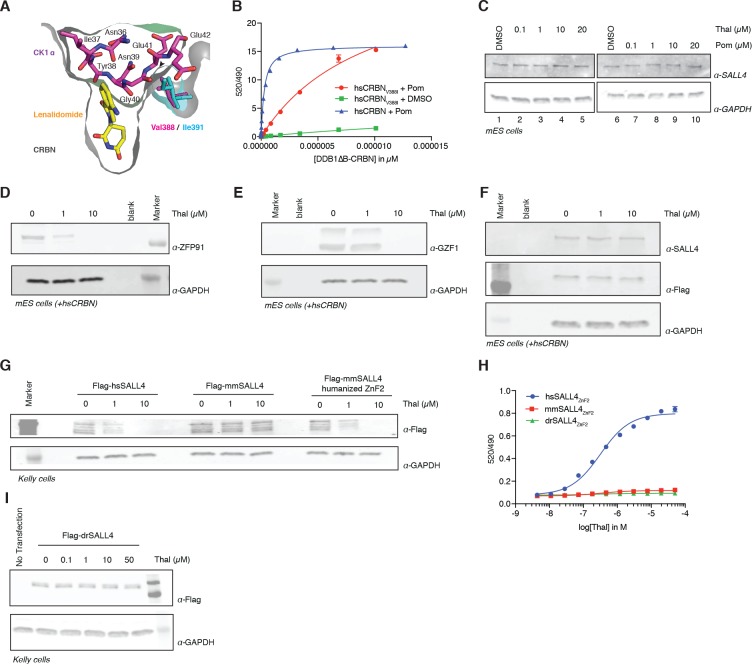
Figure 4. Identification of the sequence differences in the IMiD-dependent binding region of both CRBN and SALL4 in specific species.
(A) Close-up view of the beta-hairpin loop region of Ck1a (CSNK1A1) interacting with CRBN and lenalidomide (PDB: 5fqd) highlighting the additional bulkiness of the V388I mutation (PDB: 4ci1) present in mouse and rat CRBN. CSNK1A1 and lenalidomide are depicted as stick representations in magenta and yellow, respectively, the Ile391 of mouse CRBN corresponding to human Val388 is depicted as a stick representation in cyan, and CRBN is depicted as a surface representation. (B) TR-FRET: titration of DDB1∆B-hsCRBNSpy-BodipyFL, or DDB1∆B-hsCRBNV388ISpy-BodipyFL to biotinylated hsSALL4ZnF1-2 at 100 nM, and terbium-streptavidin at 4 nM in the presence of 50 µM pomalidomide or DMSO. (C) mES cells were treated with increasing concentrations of thalidomide and pomalidomide or DMSO as a control. Following 24 h of incubation, SALL4 and GAPDH protein levels were assessed by western blot analysis. (D) mES cells constitutively expressing Flag-hsCRBN were treated with increasing concentrations of thalidomide. Following 24 h of incubation, ZFP91 and GAPDH protein levels were assessed by western blot analysis. (E) As in (C), but measuring GZF1 and GAPDH protein levels. (F) As in (C), but measuring SALL4, hsCRBN (α-Flag), and GAPDH protein levels. (G) Kelly cells were transiently transfected with Flag-hsSALL4, Flag-mmSALL4, or Flag-mmSALL4 containing a humanized ZnF2 (Y415F, P418S, I419V, L430F, Q435H), and treated with increasing concentrations of thalidomide. Following 24 h of incubation, hsSALL4, mmSALL4, humanized mmSALL4 (α-Flag), and GAPDH protein levels were assessed by western blot analysis. (H) TR-FRET: titration of thalidomide to DDB1∆B-CRBNSpy-BodipyFL at 200 nM, hsSALL4ZnF2, mmSALL4ZnF2, or drSALL4ZnF2 all at 100 nM, and terbium-streptavidin at 4 nM. Data are presented as means ± s.d. (n = 3). (I) As in (G), but with Flag-drSALL4.


