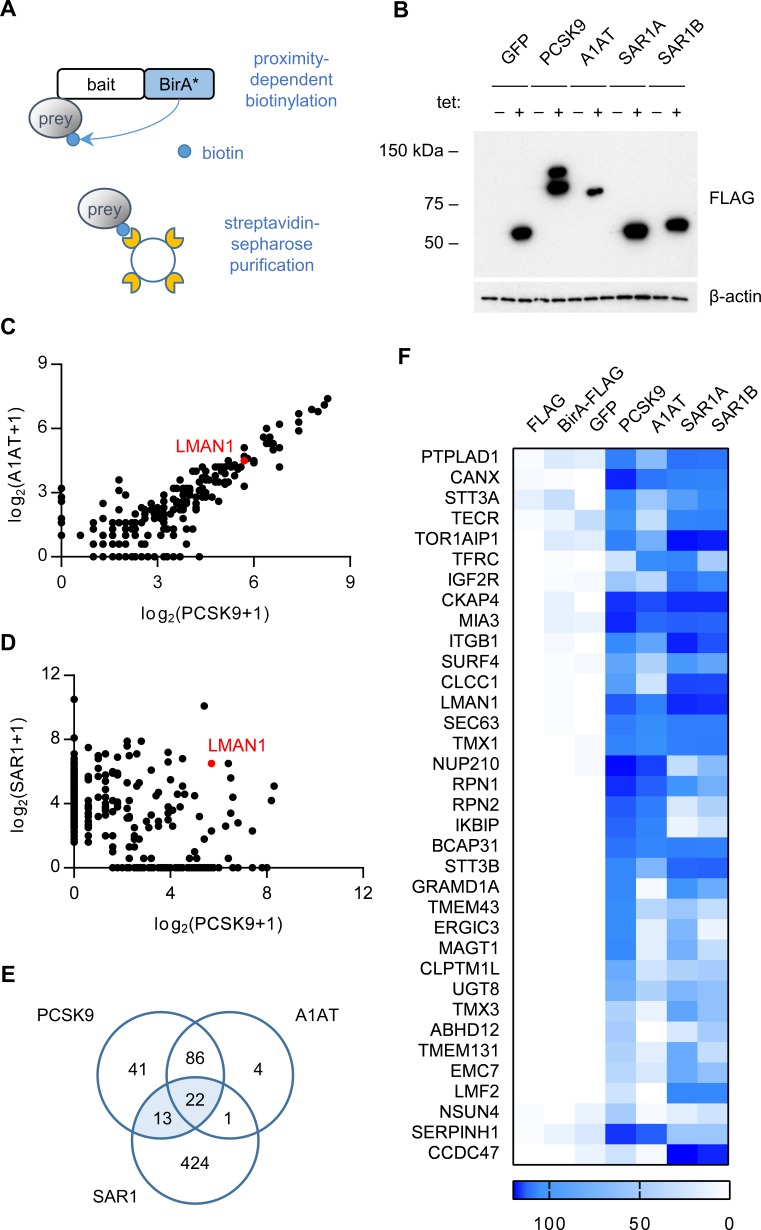
Figure 1. Proximity-dependent biotinylation with a PCSK9-BirA* fusion.
(A) Proximity detection by mass spectrometry of streptavidin-purified prey proteins biotinylated by a fusion of BirA* to a bait protein of interest. (B) Immunoblotting of lysates of cells expressing various BirA*-fusion proteins. (C) Spectral counts of prey proteins identified from lysates of cells expressing PCSK9-BirA* relative to A1AT-BirA*. (D) Spectral counts of prey proteins purified from lysates of cells expressing PCSK9-BirA* relative to the maximum spectral count from lysates of cells expressing either SAR1A-BirA* or SAR1B-BirA*. (E) Venn diagram of identified prey proteins from lysates of cells expressing BirA* fusions with PCSK9, A1AT, or the maximum for either Sar1A or Sar1B. (F) Heat map of spectral counts for candidate proteins demonstrating interaction with both PCSK9-BirA* and either SAR1A-BirA* or SAR1B-BirA*. Spectral count values represent averages of 2 biologic replicates. Only prey proteins that exhibit BFDR ≤0.01 for one or more bait proteins are displayed. Source data is provided in Supplementary file 1.

