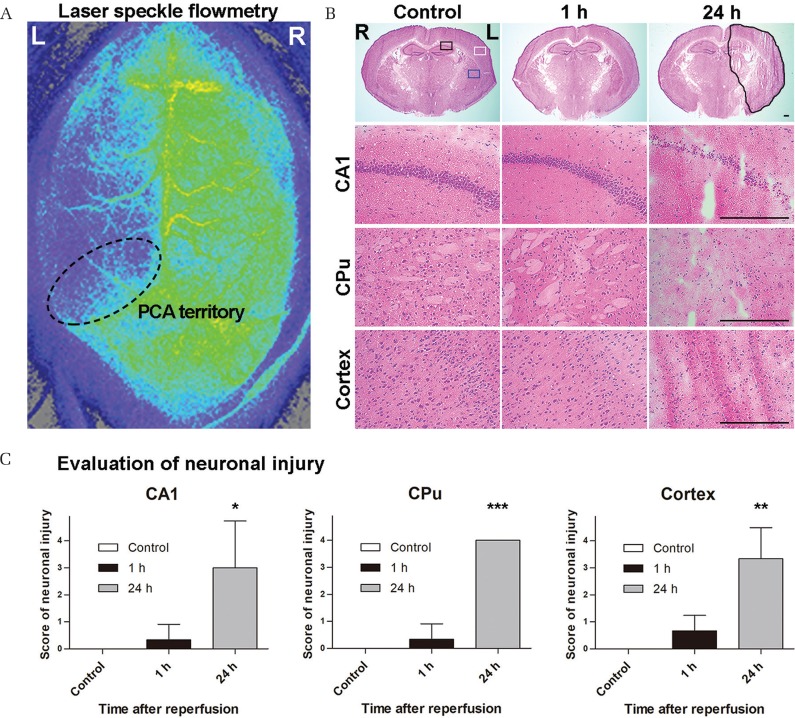
Fig. 1.
Assessment of the ischemic area after transient middle cerebral artery occlusion (tMCAO). (A) Laser speckle flowmetry shows signal attenuation in the perfusion area of the middle and posterior cerebral arteries, indicating decreased cerebral blood flow in the tMCAO model. (B) Hematoxylin and eosin staining over time after tMCAO. Hippocampal CA1 (CA1), caudoputamen (CPu), and cerebral cortex (Cortex) are presented as black, blue, and white square regions, respectively. The black free line region indicates an area of infarction with neuronal cell loss and tissue damage. One hour after tMCAO, no obvious changes are observed compared with controls. However, neural cells of the CA1, CPu, and cerebral cortex are decreased 24 h after tMCAO. These sections are 1.80-mm posterior to the bregma. The scale bars are 300 μm. (C) These graphs show the score of neuronal injury in the hippocampal CA1, CPu, and the cerebral cortex on the scales of 0–4. All lesions exhibited significant neuronal cell damage 24 h after tMCAO. *P < 0.05, **P < 0.01, and ***P < 0.001 (N = 3 each).

