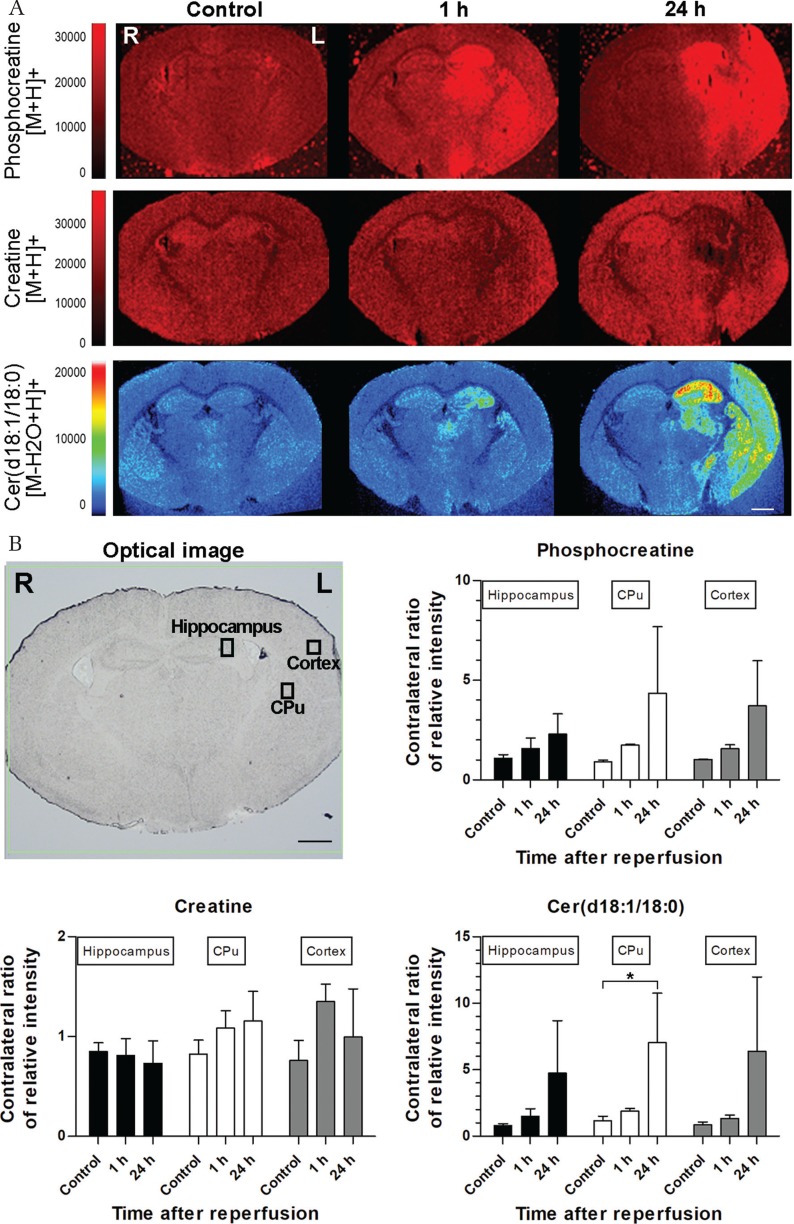
Fig. 4.
Mass spectrometry imaging (MSI) at different time points (A). Time course MSI analysis of phosphocreatine (P-Cr), creatine (Cr), and ceramide (Cer) d18:1/18:0 after transient middle cerebral artery occlusion (tMCAO) at 1.80 mm posterior to the bregma. In the control brain, P-Cr expression is low throughout the entire brain. Cr expression is higher than P-Cr and is stronger in the hippocampus. One hour after tMCAO, P-Cr expression is upregulated in the hippocampus, caudoputamen (CPu), and cerebral cortex of the ischemic hemisphere. In contrast, Cr expression is downregulated in the hippocampus and CPu of the ischemic hemisphere. Cer d18:1/18:0 expression is upregulated in the hippocampus. After 24 h, tMCAO, P-Cr, and Cer d18:1/18:0 expressions are increase in the hippocampus, CPu, and ischemic cortex. Cr expression is slightly upregulated throughout the entire brain, with the exception of the ischemic area, which shows an obvious downregulation of Cr. (B) The relative intensities were measured at three regions of interests presented in the optical image and contralateral sides. These graphs indicate the contralateral ratio of relative intensity. P-Cr and Cer d18:1/18:0 expressions increase over time, but Cr expression exhibits no such tendency. *P < 0.05. Each group included three samples. The scale bars are 1000 μm.

