Figure 2.
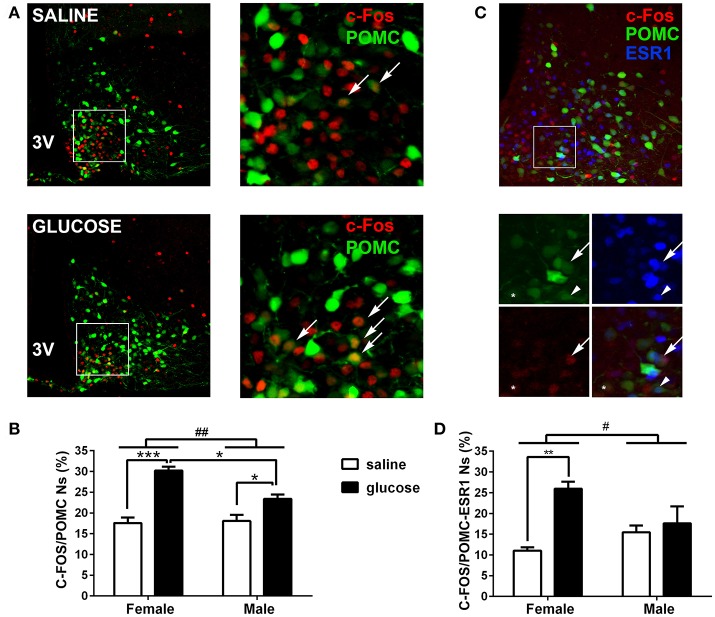
Induction of C-FOS expression by peripheral glucose overload in POMC neurons. (A) Representative coronal brain sections of POMC-EGFP female mice injected at P22-25 with saline (top) or glucose (bottom), subjected to anti-C-FOS immunofluorescence. Right panels show magnified images of squared areas depicted in left panels. Green: EGFP expression of POMC neurons. Red: C-FOS immunopositive neurons. Arrows indicate examples of POMC neurons positive for C-FOS. (B) Percentage of POMC neurons expressing C-FOS in male and female mice treated either with saline or glucose. POMC neurons per hemi-section: 58.45 ± 10.7; sections per animal: 7 ± 1.7 (mean ± SD). n = 4–5. (C) Representative coronal brain section of POMC-EGFP female mice injected at P22-25 with glucose (top), subjected to double C-FOS and ERS1 immunofluorescence. Bottom panels show magnified images of squared area depicted in top panel. Green: EGFP expression of POMC neurons. Red: C-FOS immunopositive neurons. Blue: ERS1 immunopositive neurons. Arrows: POMC/C-FOS/ESR1 neuron; *: POMC/C-FOS. Arrowhead: POMC/ESR1 neuron. (D) Percentage of POMC/ESR1 neurons expressing C-FOS in male and female mice treated either with saline or glucose. POMC neurons per hemi-section: 50.6 ± 14.1; sections per animal: 6.1 ± 0.9 (mean ± SD). n = −3–4. Error bars correspond to ±SEM. #p < 0.05 and ##p < 0.01 (TWA, sex x treatment effect); *p < 0.05, **p < 0.01, and ***p < 0.001 (Bonferroni).

